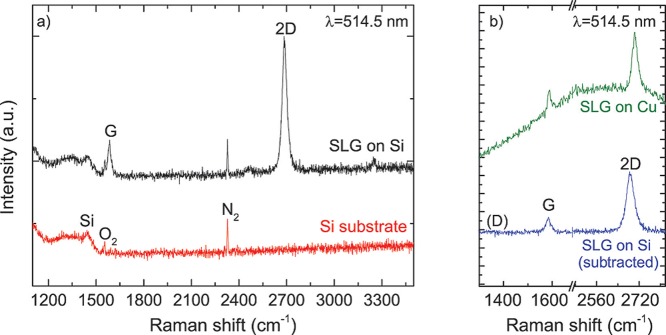
Figure 7.
(a) Raman spectra of (red curve) Si substrate and (black curve) SLG transferred on Si. (b) Raman spectra of (green curve) SLG on Cu, and (blue curve) after normalized, point-to-point subtraction of the Si substrate spectrum (shown in (a), red curve) from the spectrum of SLG transferred on Si (shown in (a), black curve).

