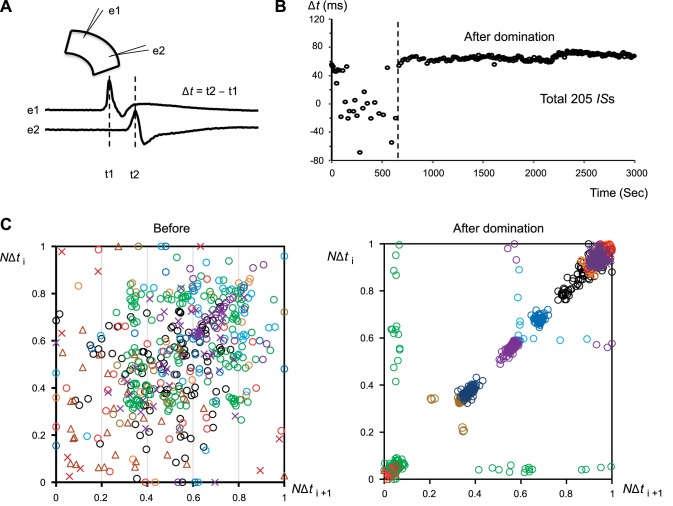
Fig. 6.
Formation of domination of IS initiation sites in a cortical slice. A: ISs induced by 2 μM bicuculline were recorded by two glass electrodes placed in the superficial layers of a coronal slice. The time difference (Δt) between an IS peak reaching the two electrodes (e1 and e2) is used as a measurement to assess domination. B: plotting of Δt against time. A sudden transition in Δt distribution (vertical broken line) demonstrates the formation of a new dominant site, with relatively fixed Δt afterwards. C: scatter plots of normalized Δt (NΔti) for each IS against that of its successor IS (NΔti+1) before (left) and after domination (right). Colors and symbols represent the data from different slices. In each slice, every Δt is normalized between the longest negative Δt (as 0) and the longest positive Δt (as 1) in each slice.

