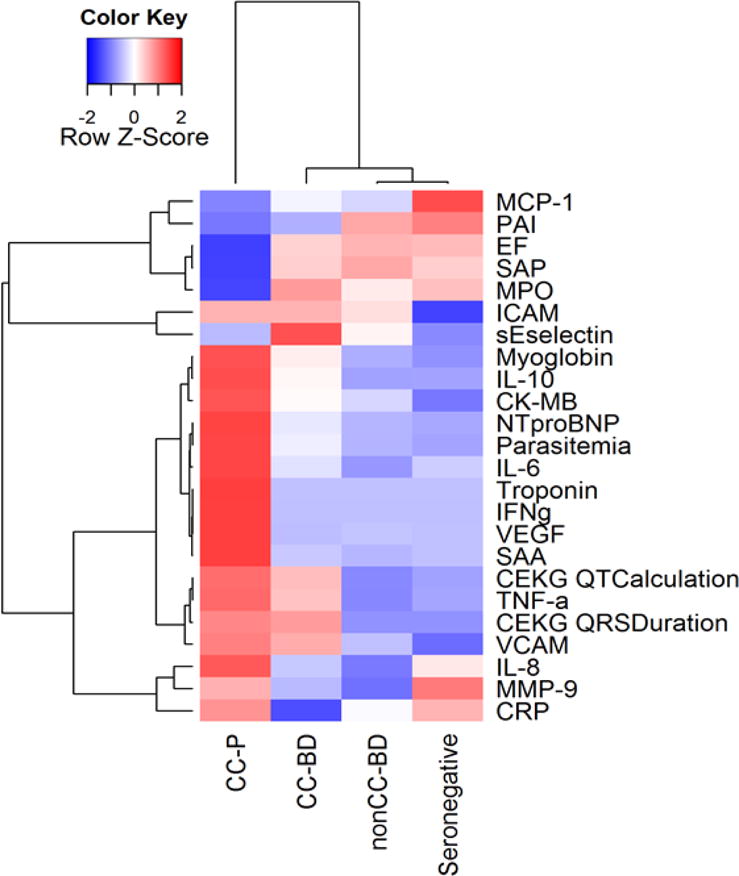
Figure 3. Heatmap of group medians of all biomarkers and cardiac parameters.

Each cell represents the median of the biomarker for the corresponding group. For each row, the medians are then scaled to mean 0 and standard deviation 1. The dendrogram is generated based on hierarchical clustering with complete linkage and 1-Pearson correlation as distance.
