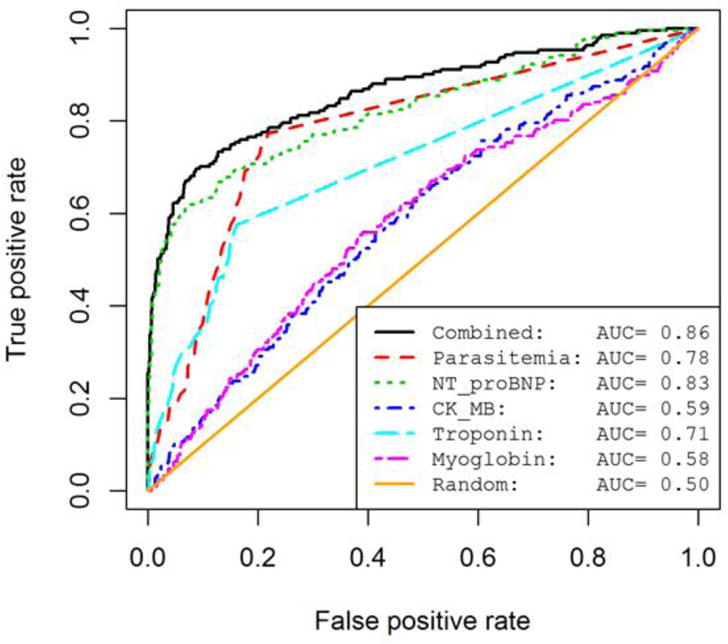
Figure 4. Receiver operator curve identifies potentially predictive biomarkers of Chagas cardiac pathology.

The ROC curves show the prediction performance across all false positive rates (False Positives/False Positives + True Negatives) and true positive rates (True Positives/True Positives + False Negatives). AUCs (Area under curve) were calculated as prediction performance measures for each predictive model. We show 5 univariate biomarker models and the combined model which includes all 5 predictors. A random predictive model is shown for comparison.
