
Fig. 3.
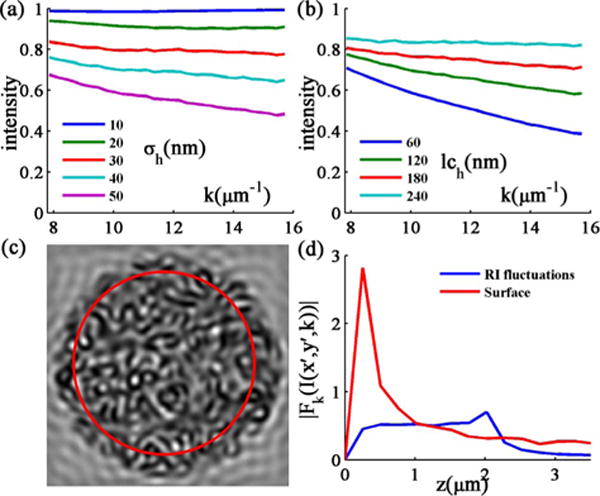
(a) Mean spectra for a fixed lch of 150 nm and σh from 10–50 nm. (b) Mean spectra for a fixed σh of 35 nm and lch from 60–240 nm. (c) Mean spectra are calculated by averaging over pixels in the red circle and further averaging over 10 samples. (d) Averaged Fourier transforms of Ih(x′, y′, k) (surface) and In(x′, y′, k) (RI fluctuations). The frequencies of spectra are translated into the depths from surface.