
Fig. 4.
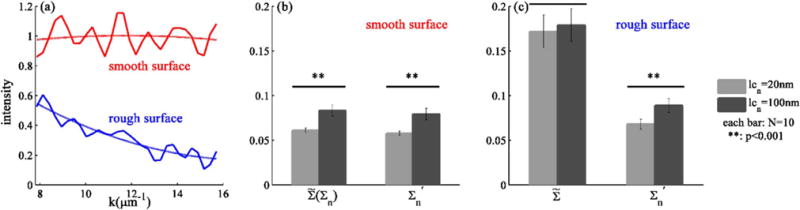
(a) Example of image spectra from the same pixel of the same medium having smooth and rough surfaces. The dash lines represent second-order polynomial fits for Is(x′, y′, k); comparison of estimated Σn from inhomogeneous media with lcn of 20 and 100 nm, calculated from sample with smooth surfaces (b) or rough surfaces (c), without ( ) or with ( ) second-order polynomial fitting.