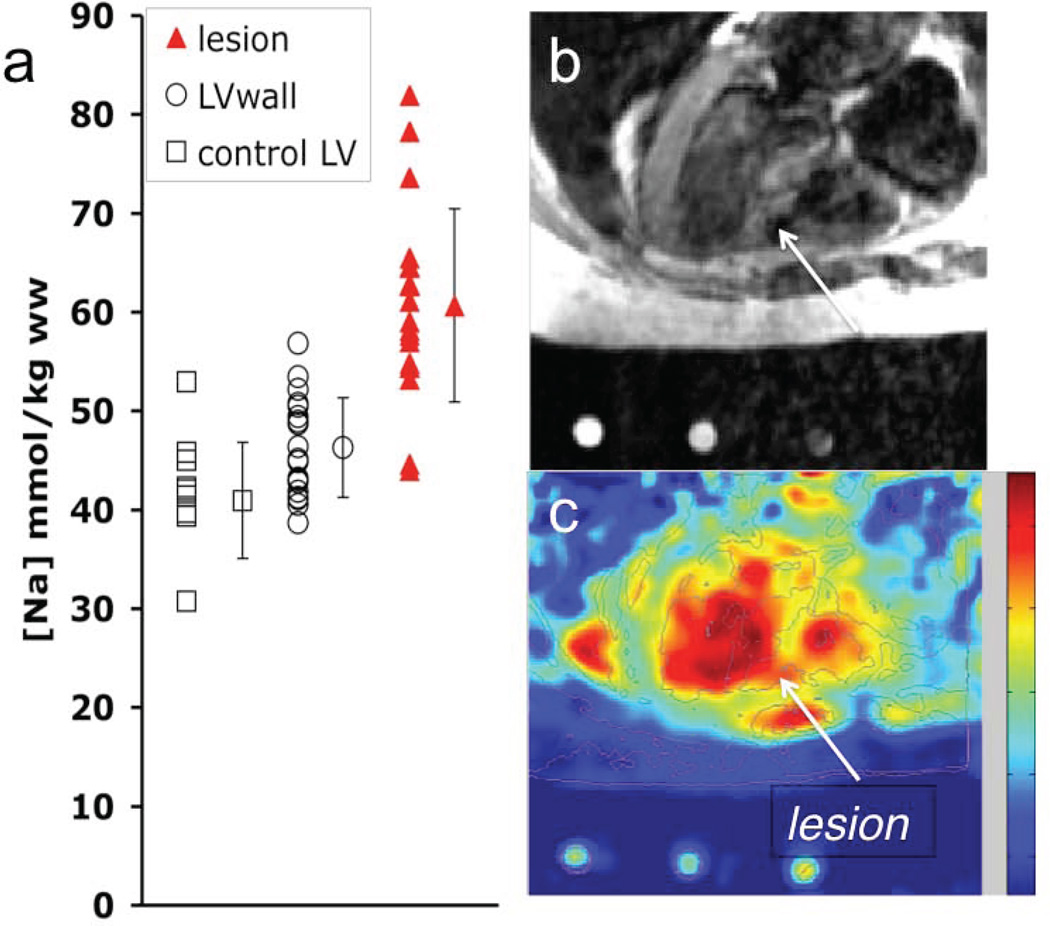
Figure 4.
(a) TSC values in infarcted and remote myocardium in 20 MI patients, and in adjacent tissue in 11 of the patients. Vertical bars denote means ±SD. TSC is significantly increased in MI vs remote tissue (P <0.001). (b) Trans-axial gated 1H fast spin-echo image, and (c) corresponding 23Na image from a 3D TPI data set (TR/TE=85/0.4 ms; isotropic spatial resolution =6 mm) from a 61-year-old man with a remote septal MI (arrow). Color scale is proportional to TSC and includes B1 correction; LV=left ventricle. (Adapted from Ref. 22).

