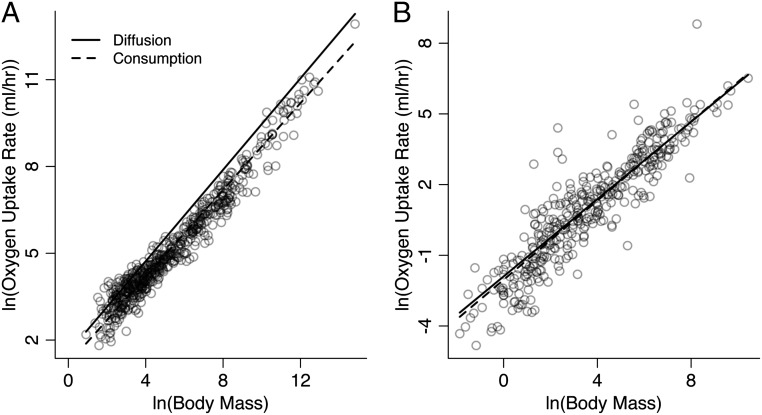
Fig. 2.
The observed body mass dependence of oxygen consumption and the predicted body mass dependence of oxygen diffusion for (A) endotherms at rest (birds and mammals; n = 580) and (B) ectotherms at rest (reptiles, fishes, and amphibians; n = 249). Dashed lines are fitted to the oxygen consumption rate data using PGLS regression (Table 1). Solid lines are the predicted relationships of oxygen diffusion (milliliters of O2 per hour) to body mass (grams) following Eq. 1. Data and sources are listed in SI Appendix, Appendixes 1–3.

