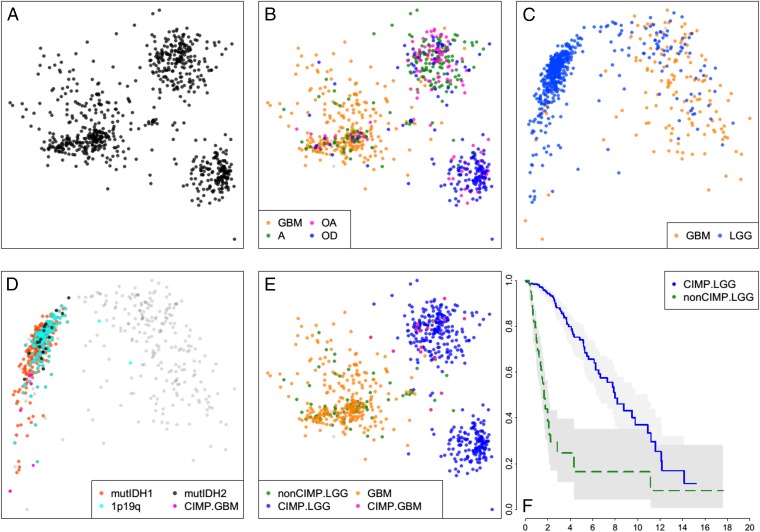
Fig. 1.
Sample similarity plots reveal four distinct subtypes of gliomas. (A) Two-dimensional MDS projection of sample similarities based on combined genome-wide sample SNA and CNA profiles. Three distinct sample clusters stand out. (B) Same as A, but with samples colored by their histologic subtype. The cluster on the Left is primarily GBMs, whereas the Top Right cluster is composed mostly of astrocytomas and oligoastrocytomas and the Bottom Right cluster is predominantly oligodendrogliomas. (C) Sample similarity visualized using a collection of ∼1,500 DNA methylation probes distinguishing CIMP versus non-CIMP tumors. (D) Coloring of all samples with mutations of IDH1/2, codeletions of chromosome arms 1p and 19q, and GBM samples previously shown to be G-CIMP shows that samples in the Left cluster are G-CIMP, whereas samples in the Right cluster are non-CIMP. (E) CIMP GBM samples all fall within or near the astro sample cluster in the SNA/CNA plot (B). Non-CIMP LGGs are genomically more like non-CIMP GBMs rather than like CIMP-LGGs. (F) Kaplan–Meier survival plot shows non-CIMP LGGs are much shorter-lived than CIMP-LGGs (P value ∼0).

