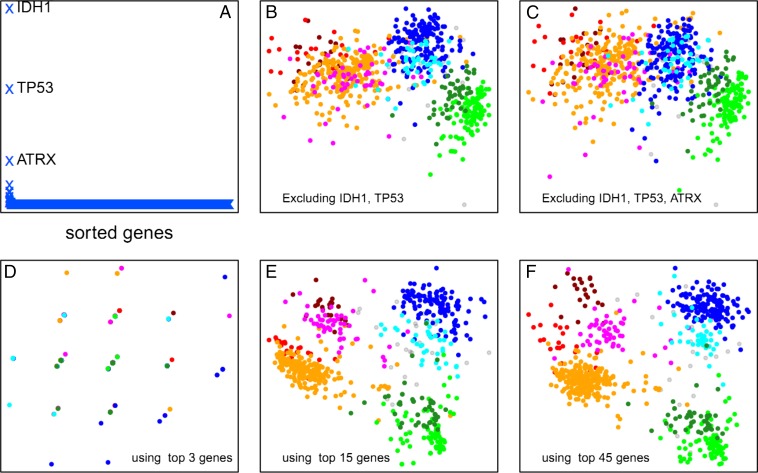
Fig. 4.
Stability of the plot structure. (A) Change in total intersample distances (y-axis, arbitrary units) when each gene in the genome is removed individually and the sample similarity plot is recalculated. Three genes (IDH1, TP53, and ATRX) have a large effect on the plot layout. (B) Coremoval of the two highest impact genes leaves the three major sample clusters largely distinct, but the subgroupings within these large clusters are lost. (C) Coremoval of the three highest-impact genes further degrades the sample clustering. However, as shown in D, the three highest-impact genes by themselves are not sufficient to reproduce any of the sample clustering. (E) The 15 highest-impact genes are sufficient to capture a large portion of the sample clustering obtained from genome-wide data. (F) The 45 highest-impact genes reasonably reproduce the clustering pattern obtained by using genome-wide data.

