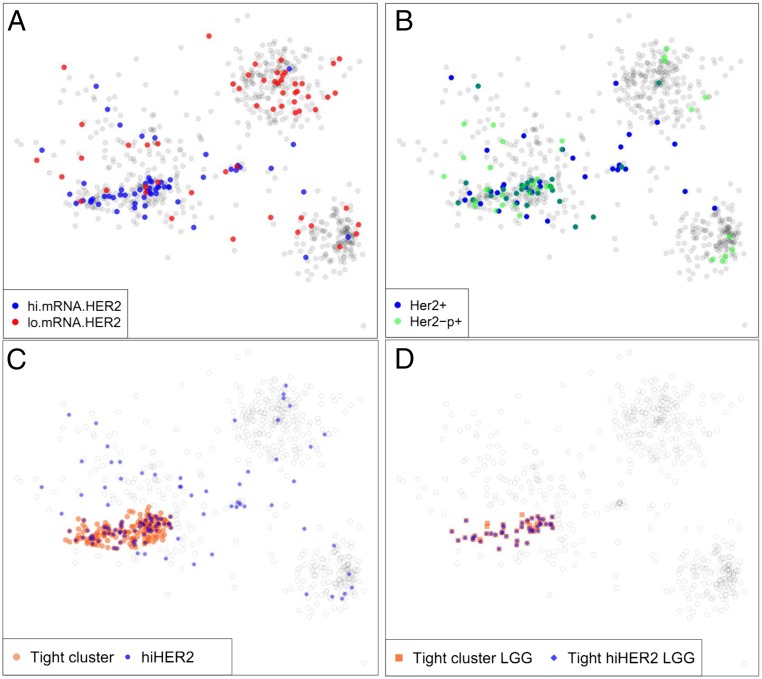
Fig. 5.
Tightly defined regions of the genomic sample similarity plot are highly enriched for specific drug targets. (A) Distribution of samples with high and low levels of Her2 mRNA. Here “high” and “low” are defined as the Top and Bottom decile of the samples. (B) Samples with total and phosphorylated Her2 protein levels in the Top decile are concentrated in a tight region of the non-CIMP cluster that coincides with the region of high Her2 mRNA expression. (C) Red disks mark the non-CIMP tight region of genomically highly similar samples. Blue disks mark samples with high levels of Her2 mRNA/protein/phosphorylated protein. (D) Within the tight non-CIMP sample cluster delineated in C, a large majority of LGG samples are high in Her2 mRNA/protein/phosphoprotein levels.

