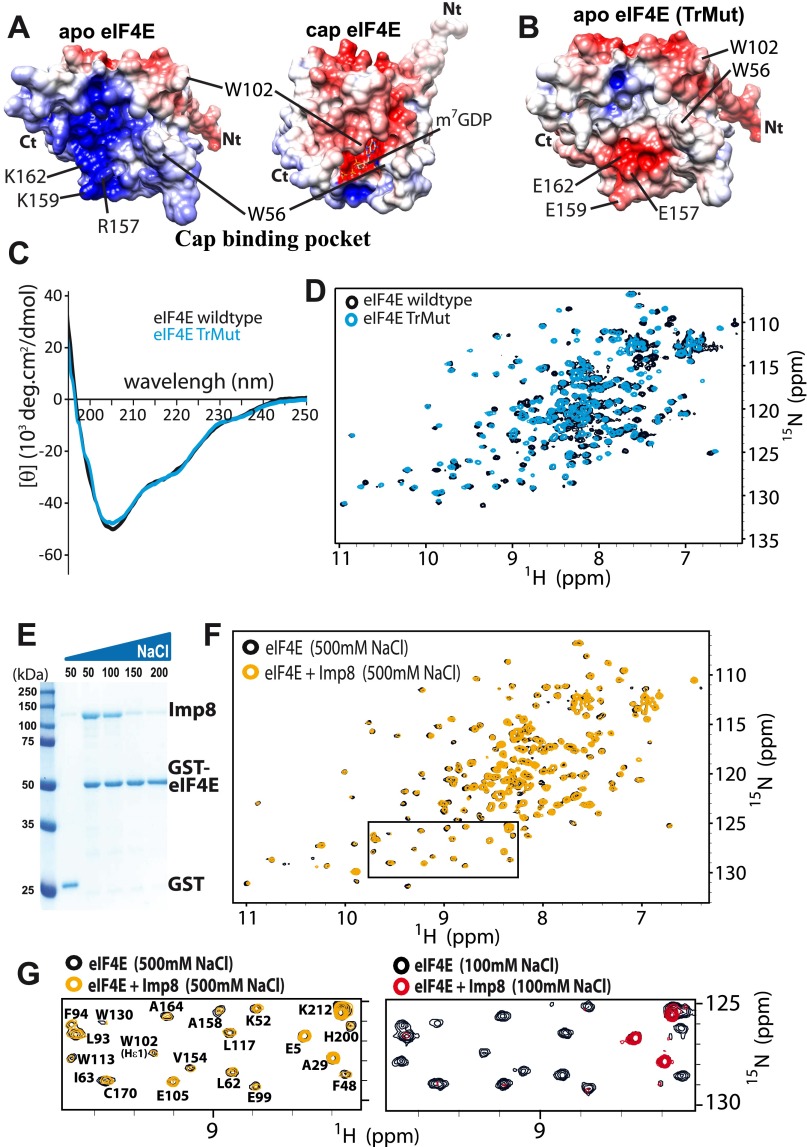
Fig. S9.
Association of eIF4E with importin 8 is driven by electrostatic forces. (A) Comparison of the surface charge distribution in the cap-binding pocket of apo- and cap-bound forms of eIF4E (PDB ID codes 2GPQ and 3AM7, respectively). Key residues used for recognition with ligands and partners are shown. Acidic (negatively charged) and basic (positively charged) regions are in red and blue, respectively. (B) Surface charge distribution of the TrMut demonstrates similarity to the cap-bound form of eIF4E in terms of charge. Comparison of the far-UV CD spectra (C) and 1H-15N HSQC spectra (D) of the eIF4E wild type (black) and eIF4E TrMut (cyan) demonstrating that the mutations have not altered the overall structure for TrMut. (E) Effect of increasing concentration of NaCl (50–200 mM) on the association of importin 8 to GST-eIF4E by GST pull-down assay. (F) Overlay of 1H-15N HSQC spectra of the eIF4E in the absence (black) or presence (orange) of importin 8 in phosphate buffer containing 500 mM NaCl. The interaction is clearly lost at high salt. Note that the other HSQC spectra shown were collected at 100 mM NaCl. (G) Enlarged section of the HSQC spectra shown in F (rectangle) is compared with the same section of HSQCs in Fig. S6 A and B.

