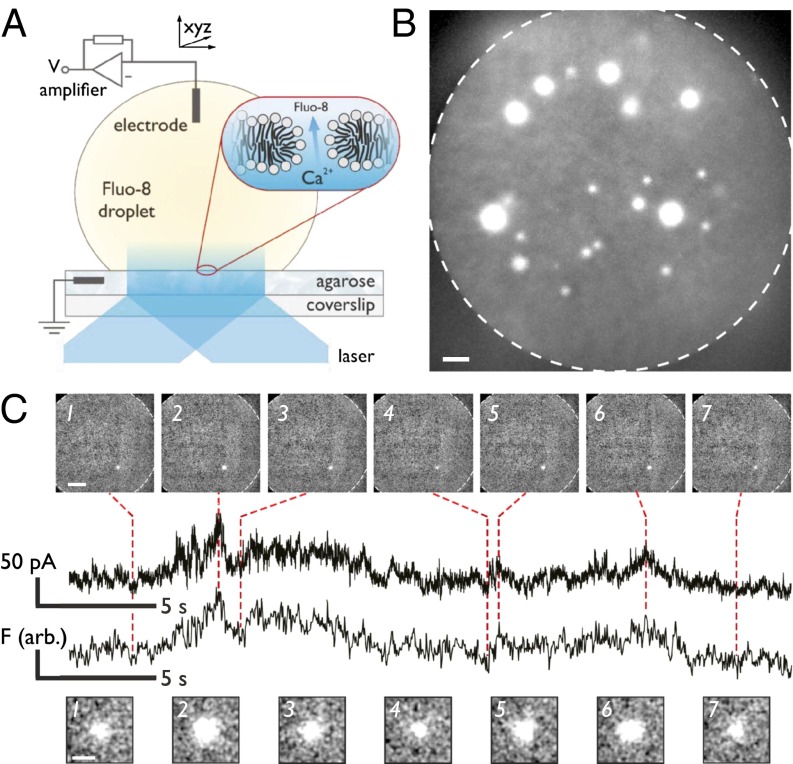
Fig. 2.
Imaging electroporation. (A) Cartoon of the DIB experimental setup. Contact between a planar substrate and an aqueous droplet that both bear a self-assembled lipid monolayer produces the bilayer. Expanded region indicates the location of the bilayer and depicts a toroidal electropore, along with the direction of motion of Ca2+ ions, enabling visualization of individual electropores by TIRF microscopy. (B) Pores are observed as bright spots within the bilayer. The edge of the bilayer is indicated by the dashed line. The image is the maximum pixel intensity of 40 frames recorded at 61.7 Hz at an applied potential of 485 mV. (Scale bar: 10 µm.) (C) When a single pore is observed (160 mV), the electrical (Upper) and fluorescence signals (Lower) correspond. Upper images: frames at 32.9 Hz demonstrating only a single pore is present. (Scale bar: 25 µm.) Lower images: expanded views of the pores showing the fluctuation in spot radius. (Scale bar: 5 µm.)

