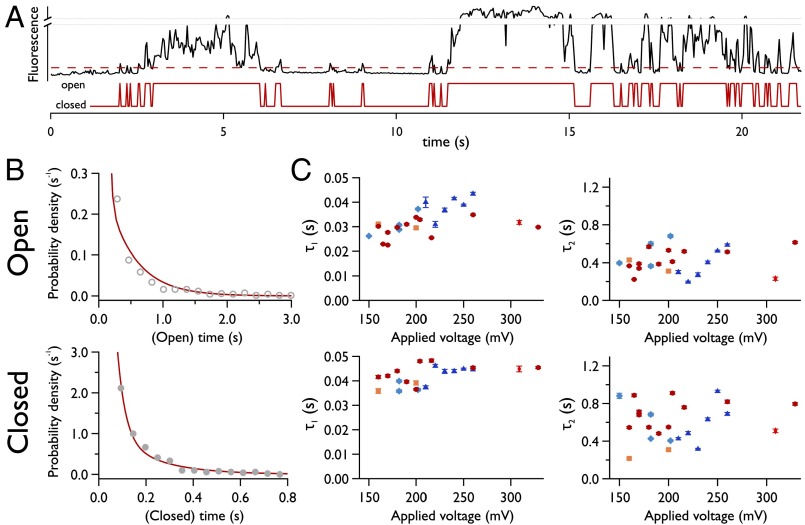
Fig. 6.
Kinetics of small electropores. (A) Fluctuating intensity of an isolated electropore (black trace; Upper) with detected open and closed states (red; Lower). The red dashed line is the threshold that defines the open and closed states, equal to 3σ of the background fluctuations. (B) Representative histograms at both extremes of Vapplied showing exponential fits to the open and closed time distributions that exhibit two decay constants. The applied potential was 260 mV for the open lifetime and 160 mV for the closed lifetime histogram. (C) Electropore lifetimes vs. Vapplied. Different markers represent data from experiments carried out on different bilayers on different days, but under identical experimental conditions. Number of pores analyzed, ≥1,900. Temporal resolution, 16.21 ms.

