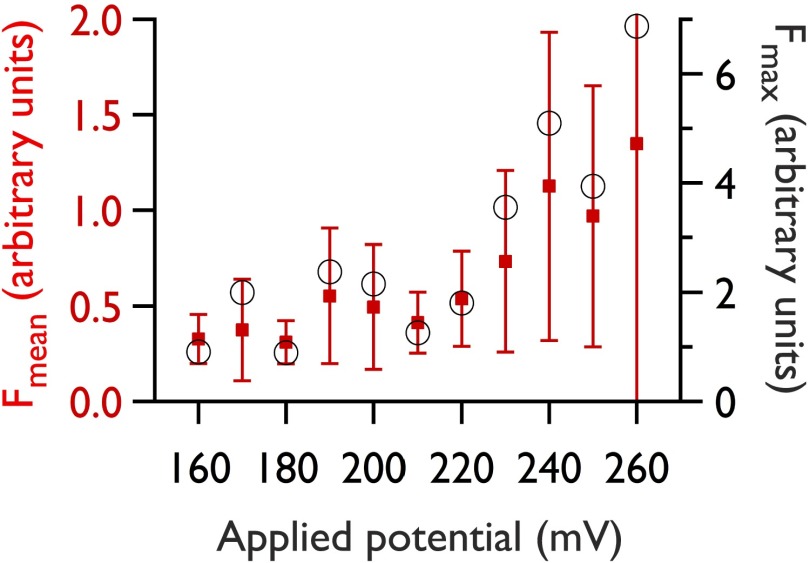
Fig. S4.
Typical fluorescence–voltage behavior during electroporation. Red squares: mean intensity of all pores within the field of view (512 × 512 pixels; visible bilayer area, 0.0188 mm2) during an oSCR recording at increasing potential. Error bars represent ±1σ. Black circles: maximum fluorescence intensity across the same run.

