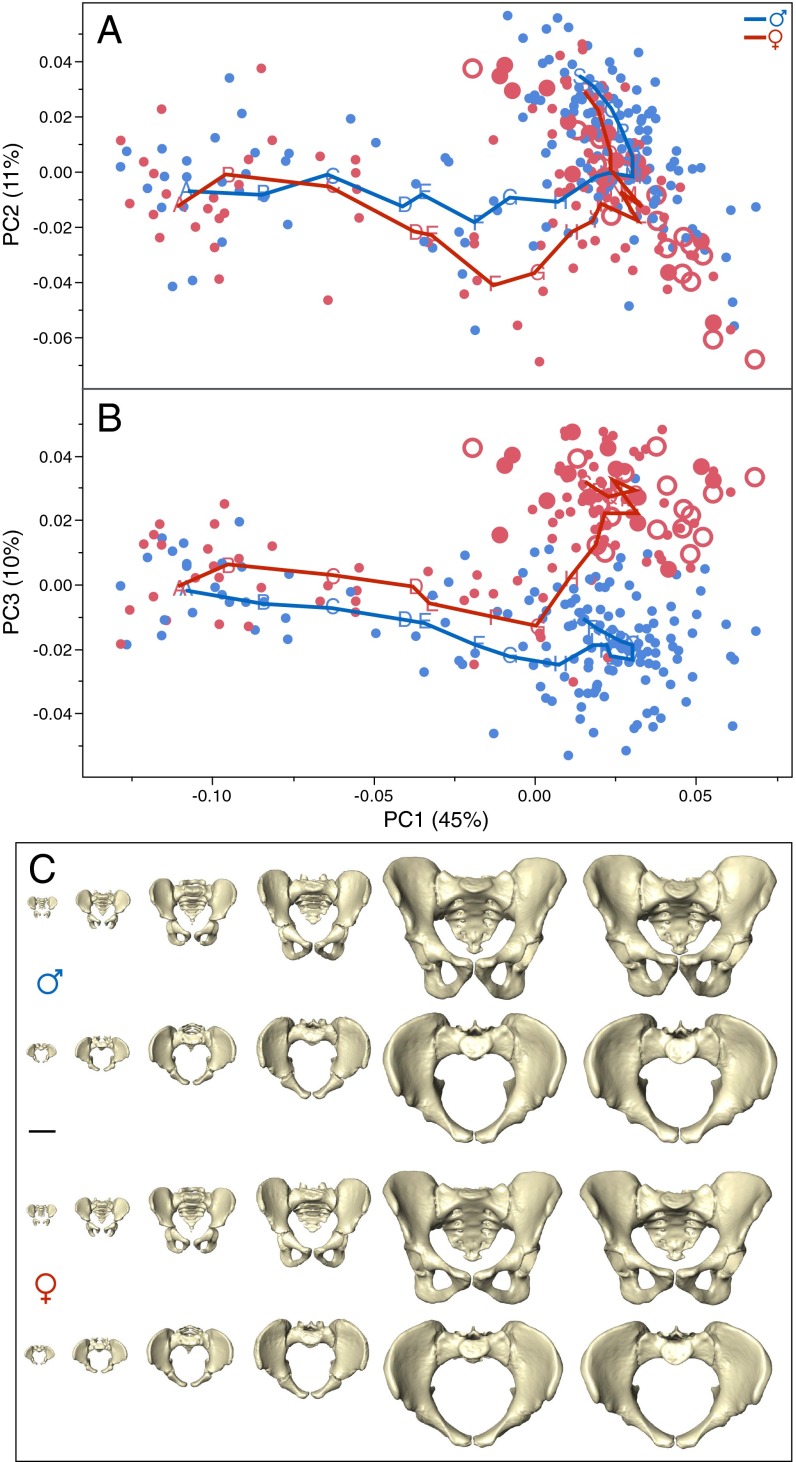
Fig. 1.
Developmental changes in human pelvic morphology from late fetal stages to late adulthood. (A and B) Bivariate plots of shape variation along PC1 (45% of total sample variation) and PC2 (11%) (A), and along PC1 and PC3 (10%) (B). Red symbols represent females; dots indicate immature or unknown parity status; filled and open circles indicate parous and nonparous status, respectively. Blue symbols represent males. Points A–S denote moving-average positions calculated at the ages indicated in Fig. 2. (C) Anterior and superior views of sex-specific pelvic mean shapes at birth and around 2, 6, 13, 25, and 80 y. (Scale bar, 5 cm.)

