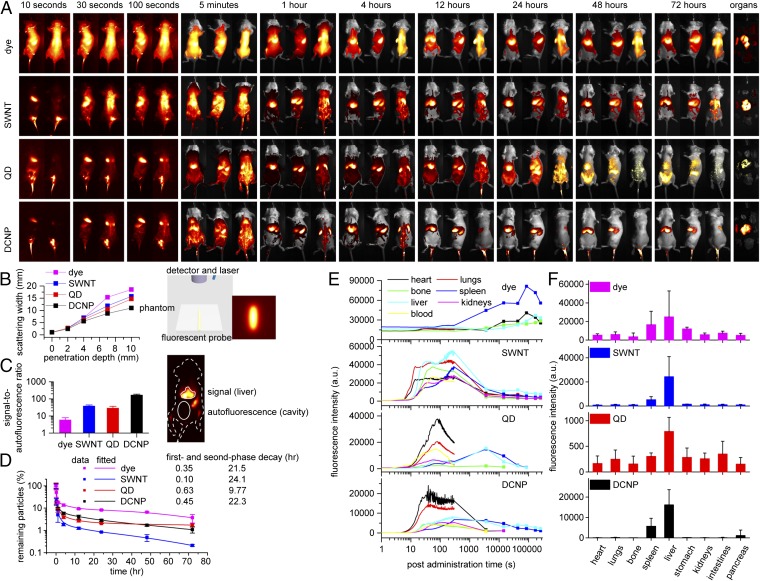
Fig. 2.
The biodistribution, pharmacokinetics, and optical properties of LbL NIR-II NPs following i.v. injection in BALB/c mice. (A) Whole-body NIR-II images at time points from 10 s to 72 h postinjection. For the first three time points, NIR-II images were extracted from the videos (Movie S1) at lateral (Left) and dorsal (Right) positions, and for the later time points NIR-II and bright-field images were taken at ventral (Left), lateral (Middle), and dorsal (Right) positions. From left to right and top to bottom, organs were presented in the order of heart, lungs, spine, spleen, liver, stomach, kidneys, intestines, and pancreas. (B) The scattering widths of NIR-II signals (Left) as a function of the penetration depth through breast-mimic phantoms (Right, scheme of the experimental setup and a typical image showing the scattering effect). (C) The signal-to-autofluorescence ratios of various NIR-II probes (Left) were quantified based on the fluorescence intensities of liver and abdominal cavity (the elliptical area, Right); the outline of the mouse is shown as a white dotted line. Data are given as mean + SD, n = 5. (D) The blood circulation profiles and fitted half-lives using a two-compartment decay model. Data are given as mean ± SD, n = 3. (E) The dynamic distribution profiles of the LbL NPs in major organs based on the fluorescence intensities from injection time to 72 h postinjection. The intensities up to 5 min (shown as lines) were extracted from the videos, and intensities at later time points (shown as lines and symbols, mean value from three to five measurements) were extracted from the NIR-II images. (F) The distribution profiles of NPs in the excised organs based on the fluorescence intensities at 72 h postinjection. Data are given as mean + SD, n ≥ 5.

