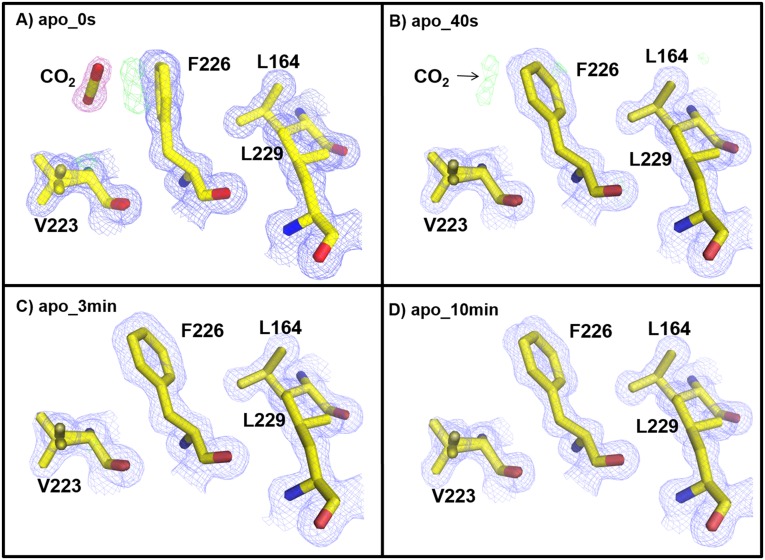
Fig. S4.
Secondary CO2 binding site in apo-hCA II: (A) 0 s, (B) 40 s, (C) 3 min, and (D) 10 min. The 2Fo-Fc (blue) and Fo-Fc (green) electron density maps are contoured at 1.2σ and 3.0σ, respectively. The 2Fo-Fc map for CO2 is highlighted in pink for clarity. Note the different orientation of the Phe226 side chain in A compared with those in B–D.

