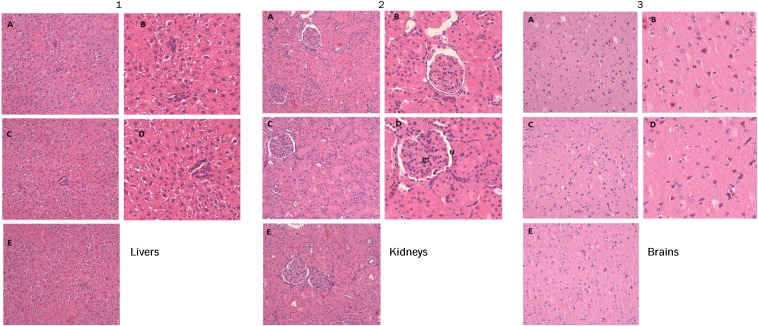
Fig. 5.
Representative images of the histological examination of H&E-stained sections of (A1–E1) livers, (A2–E2) kidneys, and (A3–E3) brains from three groups of rats. (A1–A3 and B1–B3) VG. (C1–C3 and D1–D3) TG. (E1–E3) WT group. Treated rats do not exhibit abnormal histopathological changes compared with the control group. The microphotographs were taken using a digital camera (Nikon SLR-D3000) at original magnifications of 100× and 200×. gt, Glomerular tuft; U, urinary space.

