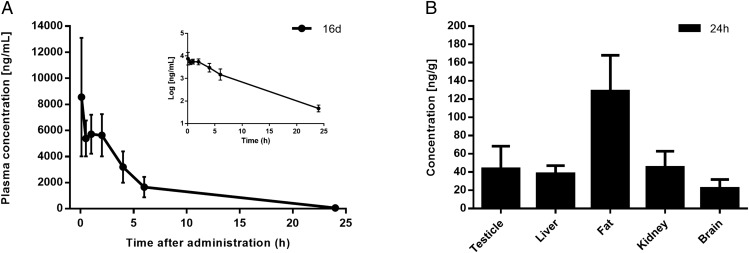
Fig. 6.
Pharmacokinetic parameters and tissue distribution in rats; 16d was administered as a single i.v. bolus injection of 10 mg/kg per group (n = 3). Data points represent the means ± SDs. (A) Plasma level curves of 16d. The semilogarithmic plot is shown in Inset. The elimination curve showed a first-order kinetic that showed an exponential decrease in the semilogarithmic plot. (B) Concentration levels of 16d in rat tissues at 24 h after single-dose administration.

