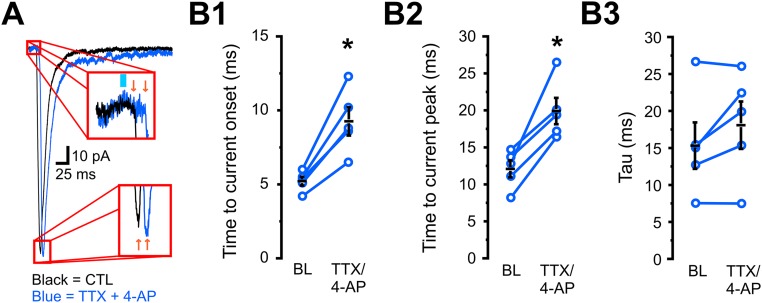
Fig. S5.
Pharmacological isolation of direct monosynaptic optically activated EPSCs results in a rightward shift in the time of EPSC onset and peak. (A) Representative averaged EPSC traces before and after TTX/4-AP application. (Inset, Top) Rightward shift in the time of EPSC onset. (Inset, Bottom) Rightward shift in the time of EPSC peak. (B, 1) Averaged EPSC onset before and after TTX/4-AP application (baseline, 5.24 ± 0.3; TTX/4-AP, 9.28 ± 1.0; n = 5; P = 0.004). (B, 2) Averaged time to EPSC peak before and after TTX/4-AP application (baseline, 12.1 ± 1.1; TTX/4-AP, 19.9 ± 1.8; n = 5; P = 0.006). (B, 3) Averaged EPSC tau before and after TTX/4-AP application (baseline, 15.5 ± 3.1; TTX/4-AP, 18.2 ± 3.2; n = 5; P = 0.55).

