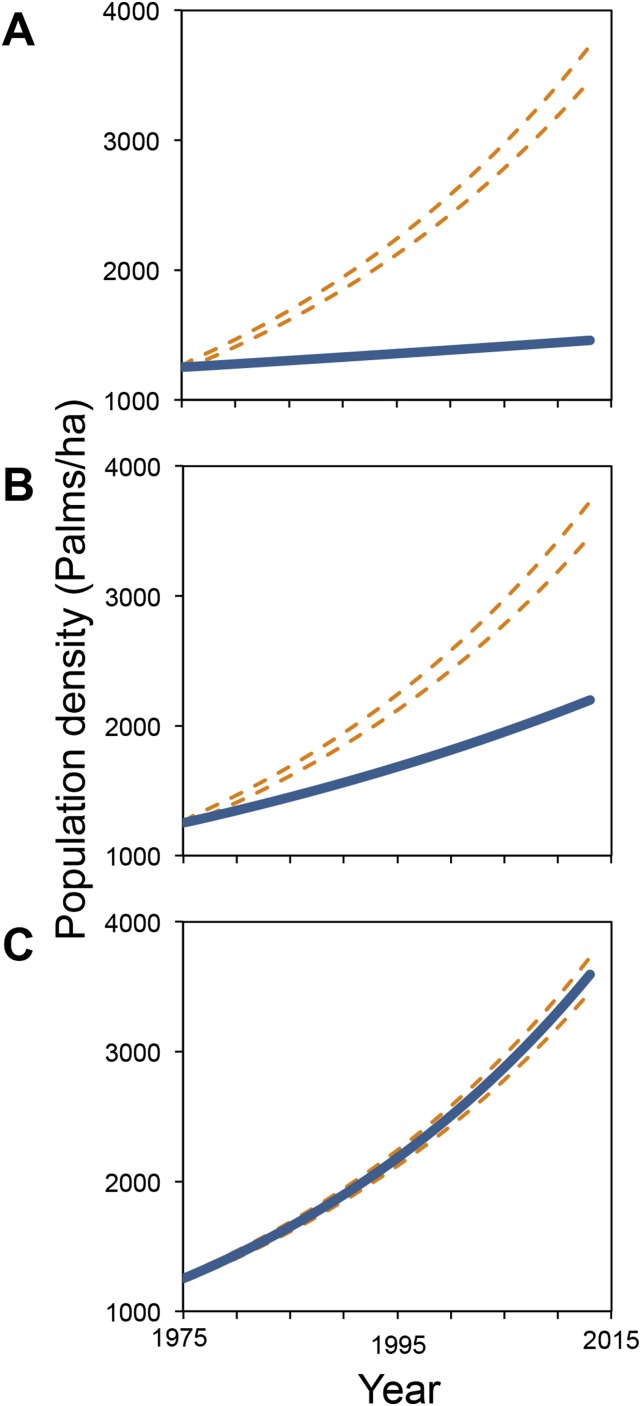
Fig. S4.
Observed and predicted population growth trajectories for A. mexicanum over a 39-y period. In all panels, dotted lines represent 95% confidence intervals of the observed trajectory generated by fitting an exponential generalized linear model to the data of population density for 1975, 1981, 2005, 2011, and 2013 (as shown in the Fig. 1) and the solid lines represent the predicted trajectories. (A) Population trajectory predicted by the matrix model constructed with data from 1975 to 1981. (B) Trajectory projected by the matrix model constructed with data from 2005 to 2013, with transition probabilities for seeds and infant palms as recorded in the 1975–1981 period. (C) Population trajectory predicted by the matrix model with data from 2005 to 2013, but increasing the progression probability of infant palms by 2.8%.

