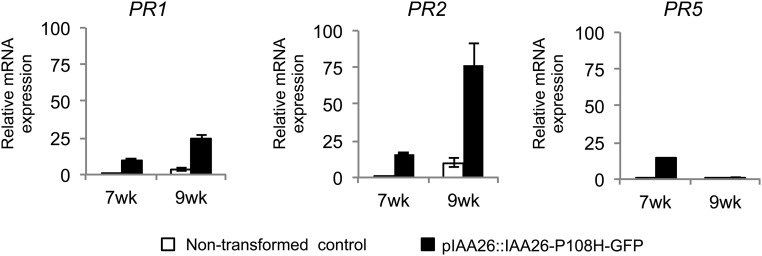
Fig. S5.
PR1, PR2, and PR5 gene expression in 7- and 9-wk-old plants. Fold-change comparisons from qRT-PCR expression analysis between nontransformed control (white bars) and pIAA26::IAA26-P108H-GFP (black bars) plants. Each bar represents the mean ± SE from three biological replicates composed of leaf tissue from four to six plants from two independent plant lines. The 18S RNA gene was chosen as an internal control for normalization.

