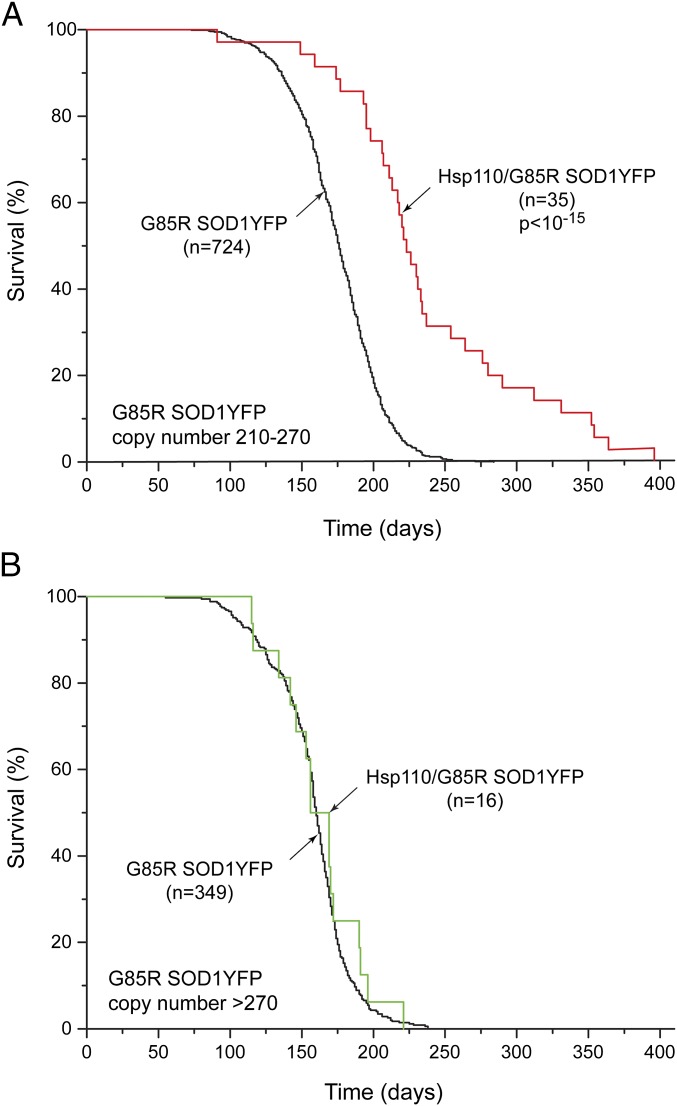
Fig. 2.
Stratification of survival of Thy1-Hsp110/G85R SOD1YFP transgenic mice relative to copy number of G85R SOD1YFP. (A) The survival curve of Thy1-Hsp110/G85R SOD1YFP mice with a G85R SOD1YFP copy number between 210 and 270 (red trace) compared with the survival curve of G85R SOD1YFP mice with a copy number between 210 and 270 (black). There is substantial prolongation of survival, similar to that observed in Fig. 1 (e.g., 56 d median survival here vs. 62 d in Fig. 1). (B) The survival curve of Thy1-Hsp110/G85R SOD1YFP transgenic mice with a G85R SOD1YFP copy number greater than 270 (green trace) compared with the survival curve of mice of the G85R SOD1YFP strain with a copy number greater than 270 (black trace). Note that the survival curves are virtually superposable, indicating no beneficial effect of transgenic Thy1-Hsp110 on survival of mice with G85R SOD1YFP copy numbers greater than 270. Note also that the survival curve of the G85R SOD1YFP strain with copy number greater than 270 is slightly shifted to the left relative to the curve of this strain with 210–270 copies as shown in A, indicating that the survival of animals with the larger copy number is decreased (median survival reduced by ∼15 d). n specifies number of mice of the designated genotype, and P values were determined as in Fig. 1.

