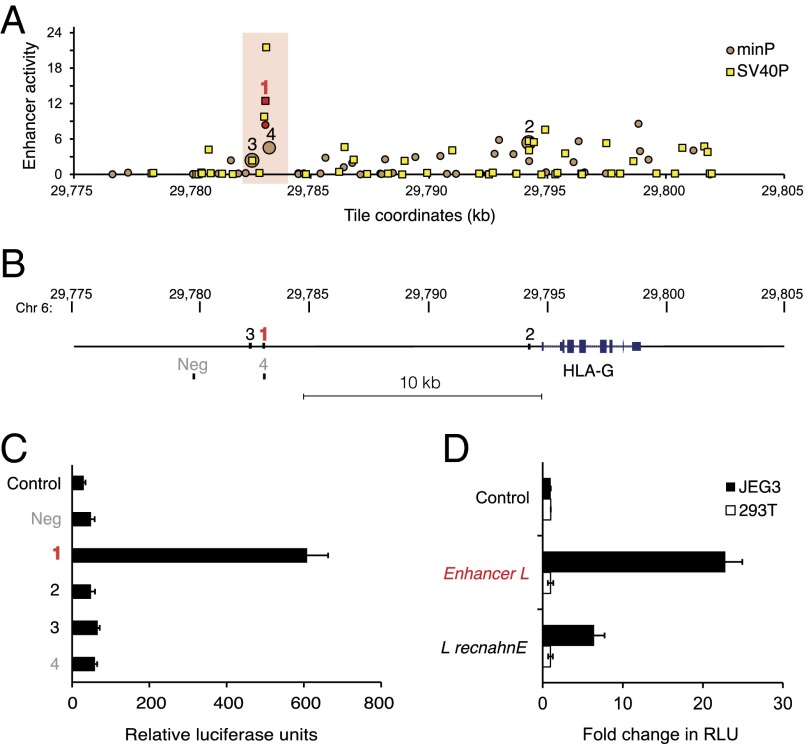
Fig. 1.
Enhancer L is a trophoblast-specific enhancer upstream of HLA-G. (A) Massively parallel reporter assay (MPRA) covering the HLA-G locus. Enhancer activity of tiles upstream of the minP (circles) and SV40P (squares) promoters, calculated as the median count of any tags representing a tile, divided by the median ratio for all tags in the library, plotted against genomic coordinates (genome build hg19). Only tiles with P < 0.05 for both biological replicates are shown. Top-ranked tiles are numbered in decreasing order of confidence. The most confident hit (1) is in red type, and the region surrounding it is highlighted with a red box. (B) Schematic representing the location of the most confident hits from the MPRA relative to HLA-G, together with a negative control region (Neg). (C) Enhancer L, marked in red, was found to be active in JEG3 cells (HLA-G+), as determined by luciferase reporter gene activity in combination with the minP promoter. Control, empty vector; Neg, negative control region. (D) Enhancer L remains active specifically in JEG3 cells when its direction is inverted. Control, empty vector; “L recnahnE,” inverted Enhancer L; RLU, relative luciferase units. Error bars represent SEM of three independent experiments.

