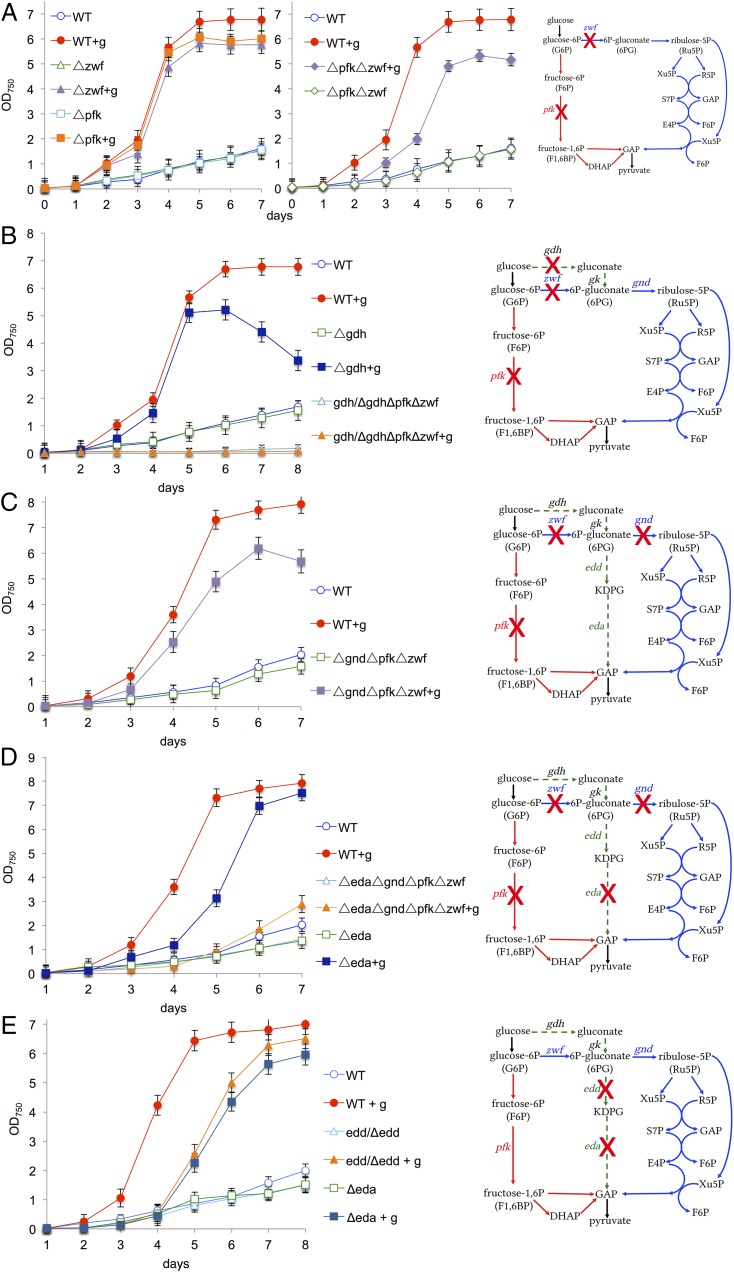
Fig. 2.
Growth of Synechocystis WT and different mutants (as indicated) under autotrophic and mixotrophic (+g) conditions in continuous light. (A–E) Curves are accompanied by simplified schemes of glycolytic routes: EMP pathway in red, OPP pathway in blue, and ED pathway in green. Crosses indicate deleted genes. Error bars represent the SD from three independent cultures, each measured in triplicate. Each growth experiment was repeated independently at least three times to ensure reproducibility. Thus, in total, nine cultures were measured. In the graph, the data of one growth experiment are shown.

