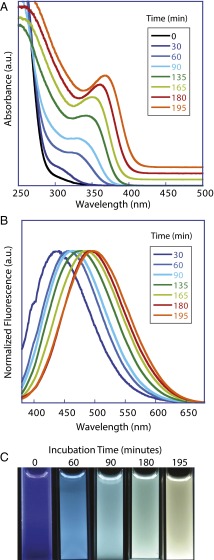
Fig. 1.
Optical properties of CdS versus synthesis time. (A) Absorbance spectra of smCSE (0.1 mg/mL) incubated with 4 mM l-cysteine and 0.5 mM cadmium acetate for various time intervals. (B) Corresponding fluorescence spectra at selected time intervals using an excitation wavelength of 350 nm. (C) Photographs of photoluminescence under UV light at various time intervals. The red shift of the absorbance and fluorescence maxima indicates an increase in the mean size of the CdS nanocrystals with incubation time.

