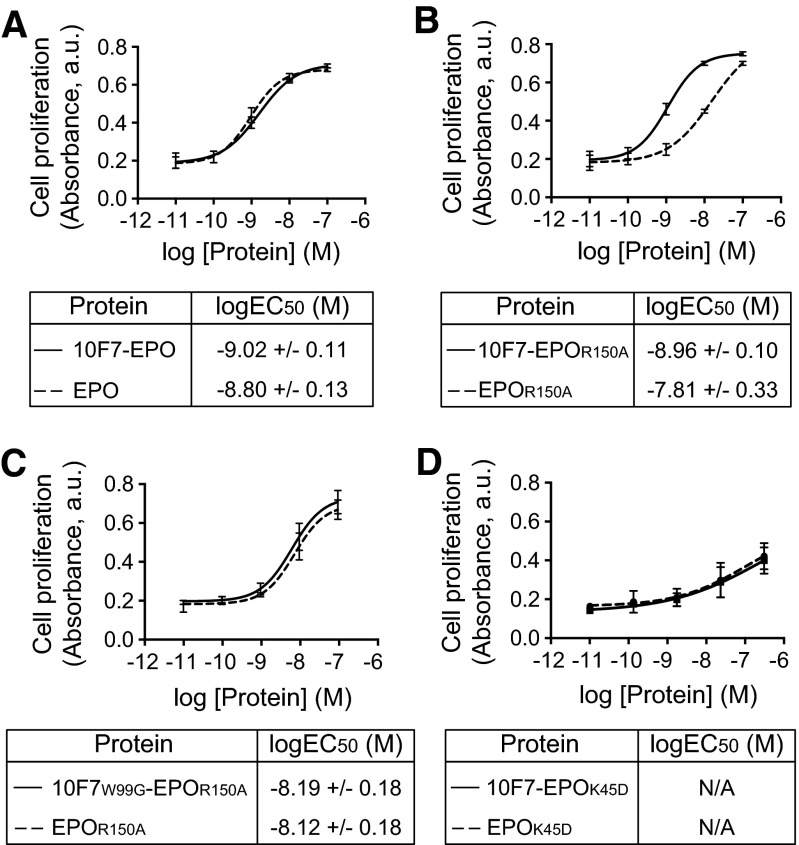
Fig. S1.
In vitro verification of chimeric activator activity. Erythroleukemia TF-1 cells were treated with 10F7-EPO variants or unfused control proteins and allowed to proliferate for 72 h before the addition of WST-1 reagent. Proliferation was plotted against protein concentration. (A) 10F7-EPO vs. EPO. (B) 10F7-EPOR150A vs. EPOR150A. (C) 10F7W99G-EPOR150A vs. EPOR150A. (D) 10F7-EPOK45D vs. EPOK45D. Plots were fitted by nonlinear regression to determine logEC50 values. Graphs display mean ± SEM (n = 3). N/A, not applicable; it was not possible to calculate a logEC50 for proteins containing the K45D mutation because saturation was not achieved. Note that the shift in EC50 values comparing EPO with EPOR150A (∼10-fold) (Fig. S1 A vs. B) corresponds roughly to the decreased binding of EPO vs. EPOR150A to EPO-R (∼12-fold) (Fig. 2B).

