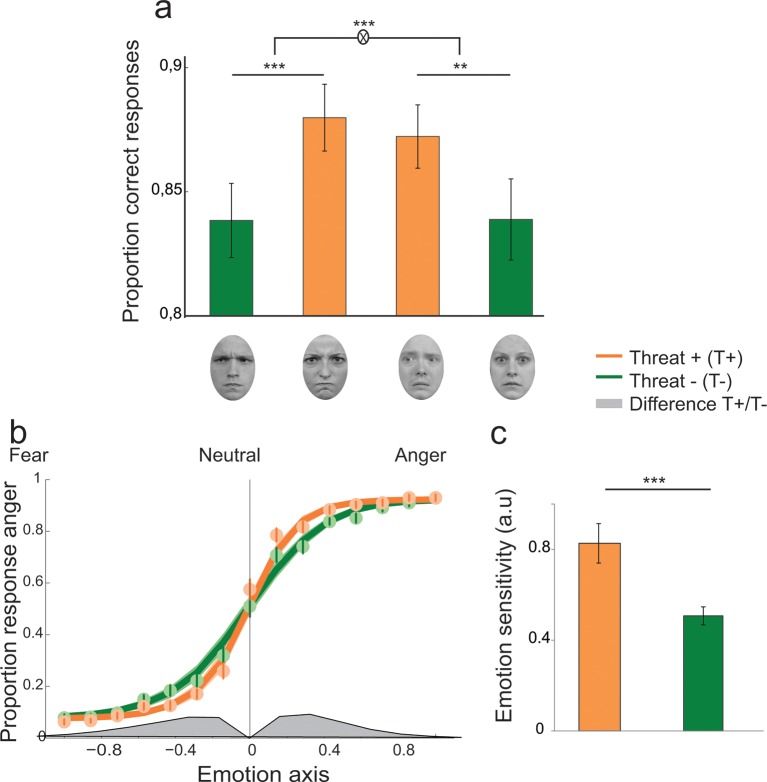
Figure 3. Enhanced recognition accuracy and perceptual sensitivity to threat-signaling emotions.
(a) Proportion of correct responses for (from left to right) averted/anger, direct/anger, averted/fear and direct/fear. THREAT+ combinations of gaze and emotion (in orange) were associated with increased recognition accuracy. (b) Psychometric function representing the proportion of ‘anger’ responses as a function of the evidence for anger (proportion morph, 0 = neutral, negative towards fear, and positive towards anger) for THREAT+ (orange) and THREAT− (green) combinations of gaze and emotion. Dots and attached error bars indicate the human data (mean ± s.e.m.). Lines and shaded error bars indicate the predictions of the best-fitting model. (c) Parameter estimate for the slope of the psychometric curve (corresponding to emotion sensitivity) for THREAT+ and THREAT− combinations. **p < 0.01, ***p < 0.001.

