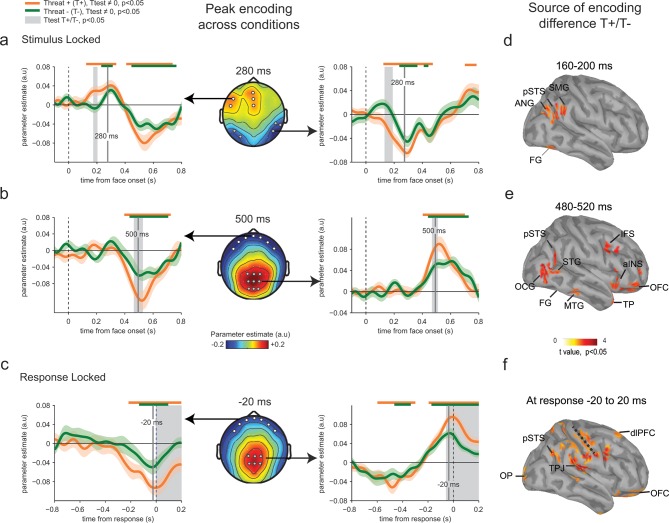
Figure 4. Enhanced neural encoding of threat-signaling emotions.
(a) Middle panel: scalp topography of neural encoding at 280 ms, corresponding to its first peak of the encoding of emotion strength averaged across conditions (peak of deviation from zero), and expressed as mean parameter estimates in arbitrary units (a.u.). Dots indicate electrodes of interest where neural encoding was maximal. Left and right panels: encoding time course for THREAT+ and THREAT− conditions at electrodes of interest. Shaded error bars indicate s.e.m. Thick orange and green lines indicate significance against zero at a cluster-corrected p-value of 0.05. Shaded grey areas indicate significant differences between THREAT+ and THREAT− conditions at p < 0.05. (b) Same conventions as (a) at the second neural encoding peak at 500 ms. (c) Same conventions as (a) at the third neural encoding peak at response time. (d) Estimated cortical sources of the encoding difference between THREAT+ and THREAT− conditions at the time of significant difference between conditions at 170 ms. (e) Same as (d) at 500 ms. (f) Same as (d) at response time. FG: fusiform gyrus, pSTS: posterior superior temporal sulcus, SMG: supramarginal gyrus, ANG: angular gyrus, STG: superior temporal gyrus, MTG: middle temporal gyrus, OCG: occipital gyrus, aINS: anterior insula, IFS: inferior frontal sulcus, TP: temporal pole, OFC: orbitofrontal cortex, OP: occipital pole, TPJ: temporo-parietal junction, dlPFC: dorsolateral prefrontal cortex.

