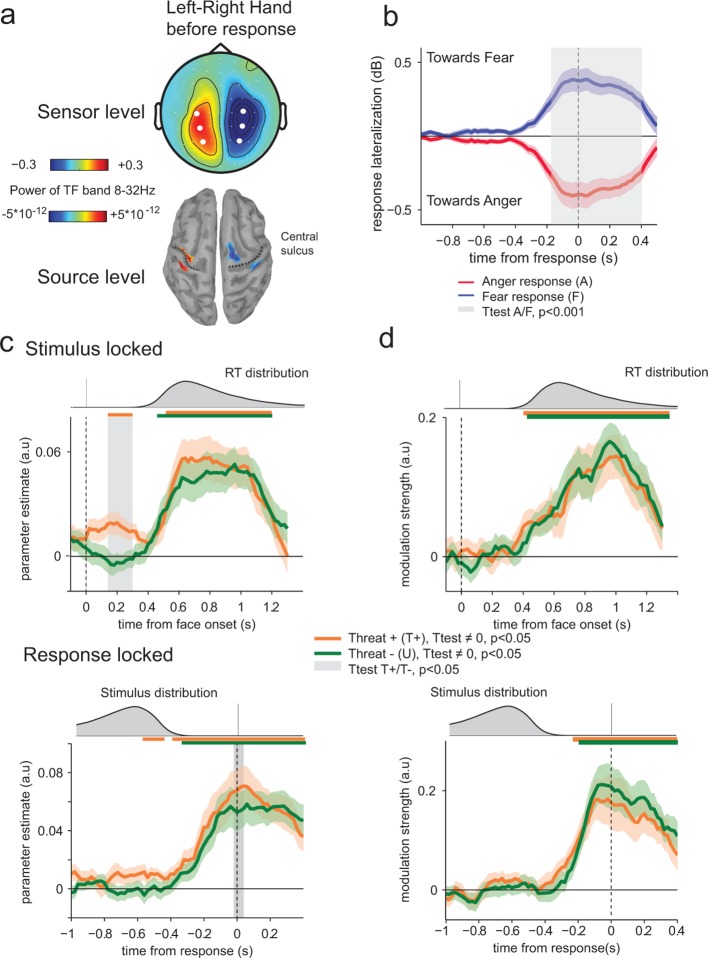
Figure 6. Encoding of threat-signaling emotions in motor response lateralization measures.
(a) Top panel, scalp topography before response of the time frequency power in the 8–32 Hz band in the last 100 ms before response, for the trials where subjects responded with their left hand minus the trials where they responded with their right hand. Dots correspond to the selected electrodes, where the effect was maximal. Bottom panel: corresponding neural sources. (b) Time course of response lateralization (time frequency power activity from the contralateral electrodes minus ipsilateral electrodes to the hand used to respond ‘fear’) towards anger and fear when the choice was anger (red) or fear (blue). Shaded error bars indicate s.e.m. The shaded gray area indicates a significant difference in motor lateralization between Anger and Fear responses. (c) Encoding of emotion strength in response lateralization index for THREAT+ (orange) and THREAT− (green) conditions. Differences between conditions are observed at 200 ms after stimulus onset (stimulus-locked, upper panel) and at response time (response-locked, lower panel). Conventions are the same as in Figure 4. (d) Time course of neural-choice correlations, expressed as the modulation of additive bias by motor lateralization encoding residuals in arbitrary units (a.u.) stimulus-locked (upper panel) and response locked (lower panel). Conventions are the same as in Figure 4.

