
Figure 1. Screen approach and mHtt IB-forming mutants.
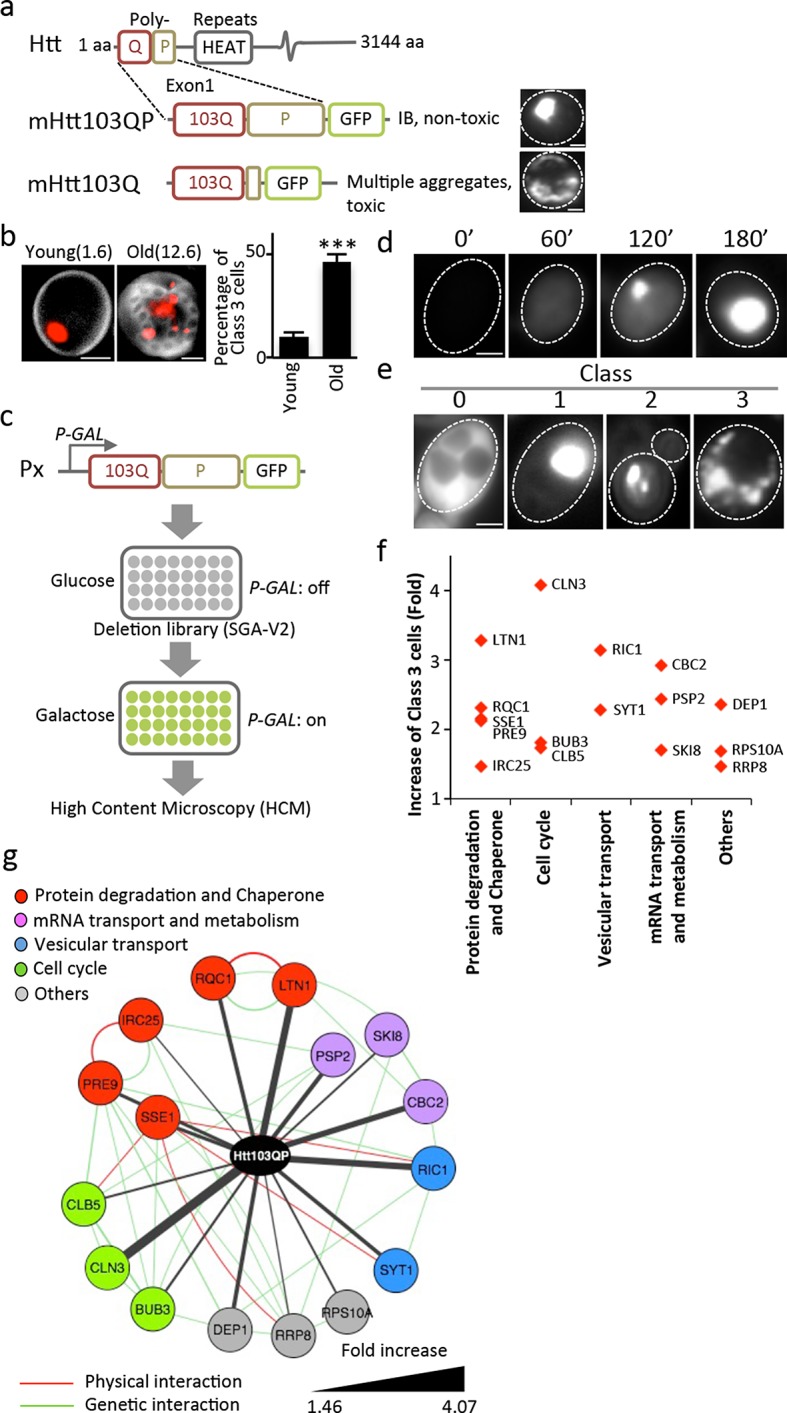
(a) Aggregation of different mHtt reporters as indicated. (b)Morphology of mHtt103QP aggregates (red) in young and old (1.6 and 12.6 bud scars (white), respectively) cells. Scale=2 μm. Bar graph shows percentages of Class3 cells in young and old cells. Mean ± s.d. (c) Schematic description of the HCM-based screen. (d) Htt103QP aggregation 0, 60, 120 and 180 min after HTT103QP induction. (e)Representative pictures of Class 0, 1, 2 and 3 cells. (f) Mutants displaying increased% of Class 3 cells, grouped according to functions. Y-axis shows fold increase relative to wild type. (g) Physical (red) and genetic (green) interaction between Class 3 genes/proteins and their quantitative interaction (thickness of grey lines) with mHtt103QP as indicated.