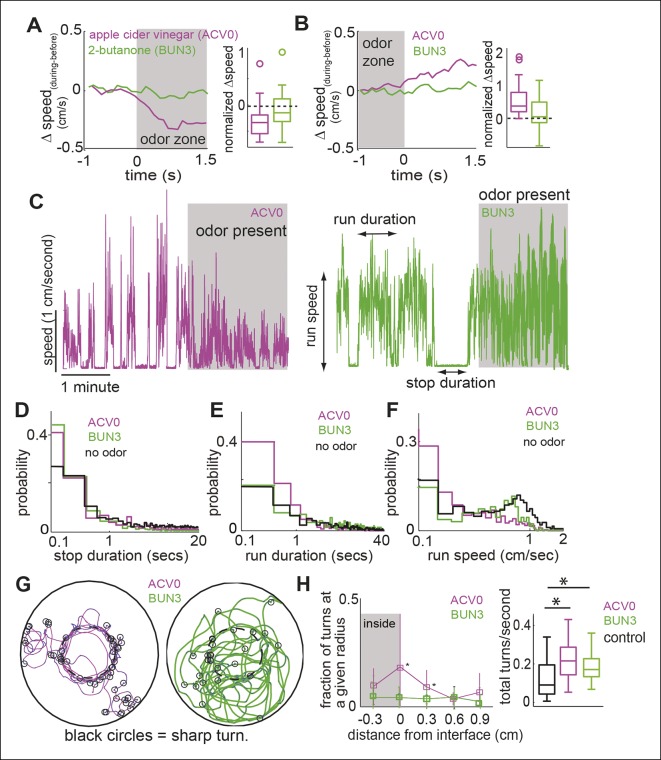
Figure 2. Different attractive odors modulate different motor parameters.
(A) Flies decrease their speed when they enter the odor-zone in the presence of ACV0 but not BUN3. Left: Mean changes in speed between before and during periods. (n = 29 for apple cider vinegar (ACV0), n = 31 for 2-butanone [BUN3]). Right: Box plots showing the distribution of speed differences upon entering the odor zone. Normalization process in Table 1. (B) Same as in A except that change in speed as the fly leaves the odor-zone is plotted. (C) Sample trace showing speed as a function of time for a fly in response to ACV0 and another fly in response to BUN3. Stop duration decreases for both ACV0 and BUN3 but run duration and run speed only decreases for ACV0. Shaded regions represent the time during which odor is present . (D,E,F) Group statistics for stops and runs. (Black: before period (726 runs and 725 stops from 60 flies), magenta: ACV0 (n = 649), Green: BUN3 [n = 296]). Distribution of stop durations is significantly different for both ACV0 and BUN3 (p <10-9 for both ACV and 2-butanone, KS test). Run duration and run speed is only different for ACV0 (p <10-9 for ACV, p=0.08 for BUN3). (G) A fly preferentially executes sharp turns (marked by open black circles, see Materials and methods) at the interface between the odor-zone and no odor zone in the presence of ACV0 but not in the presence of BUN3. Traces are tracks of a single fly. (H) Left: Group data showing that flies preferentially execute turns right at the odor interface in ACV0 but not BUN3 (p <0.001 for both significantly different points). Right: Total turn frequency increases in response to both odors. Black: before period (n = 60), magenta: ACV (n = 29), Green: 2-butanone (n = 31).

