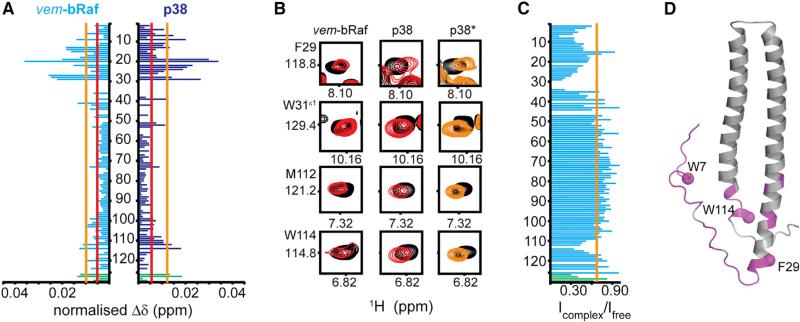
Figure 5. Interaction of N-Cdc37 with Nonclient Kinases.
(A) CSP pattern for the interaction of pN-Cdc37 with vem-bRaf and p38. CSPs greater than the mean or one SD above the mean are marked by red and yellow lines, respectively.
(B) Representative set of HSQC signals affected by vem-bRaf or p38. The right panel (marked p38*) illustrates the same signals for the titration of N-Cdc37 with p38.
(C) Signal intensity ratio for free over vem-bRaf-bound pN-Cdc37. The average drop in intensity is marked by a yellow line.
(D) Residues for which significant signal attenuation is observed upon addition of vem-bRaf are highlighted on the structure of N-Cdc37. The Cα atoms of W7, F29, and W114, which experience the most prominent attenuation, are shown as spheres. In (A) and (C), signals of Trp 1H-15Nε1 pairs are shown in green bars (W7, W31, W85, and W114, top to bottom) (see also Figure S5).

