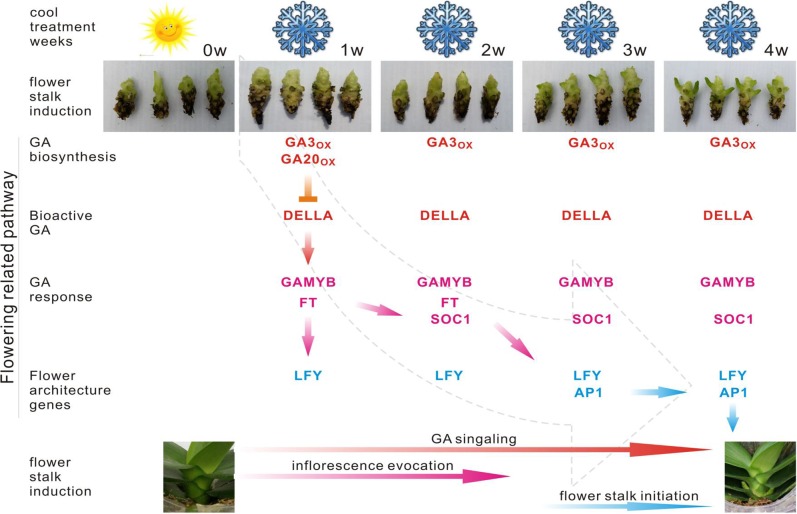
Figure 6. Predicted pathway in the regulation of spike induction in Phalaenopsis.
Red indicates that the involved genes are more highly expressed in the GA biosynthesis pathway; pink gene names indicate their differential expression in the GA response pathway. Blue gene names represent the activation of flower architecture genes. Red arrows show the steps of the GA signaling stage; Pink arrows direct the steps of inflorescence evocation stage; Blue arrows reveal the steps of flower stalk initiation stage. Inverted T indicates the genes downregulated 2X over. GA20ox, GA3ox, GAMYB, FT, SOC1, LFY and AP1 are upregulated 2X over.

