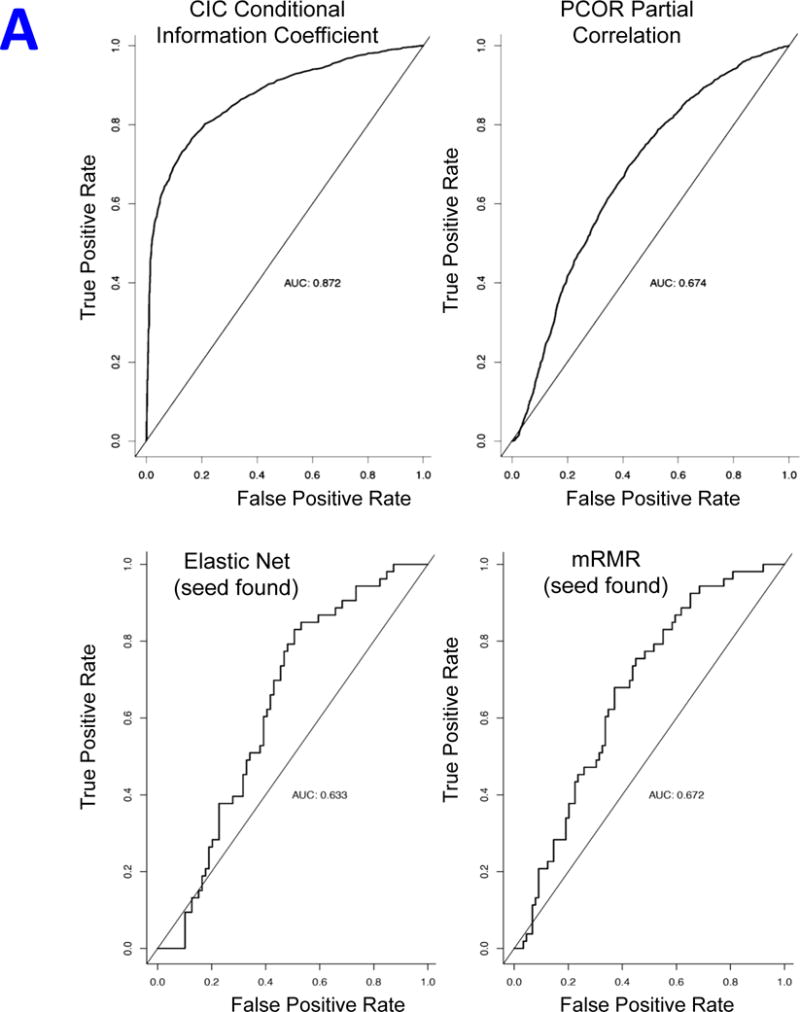
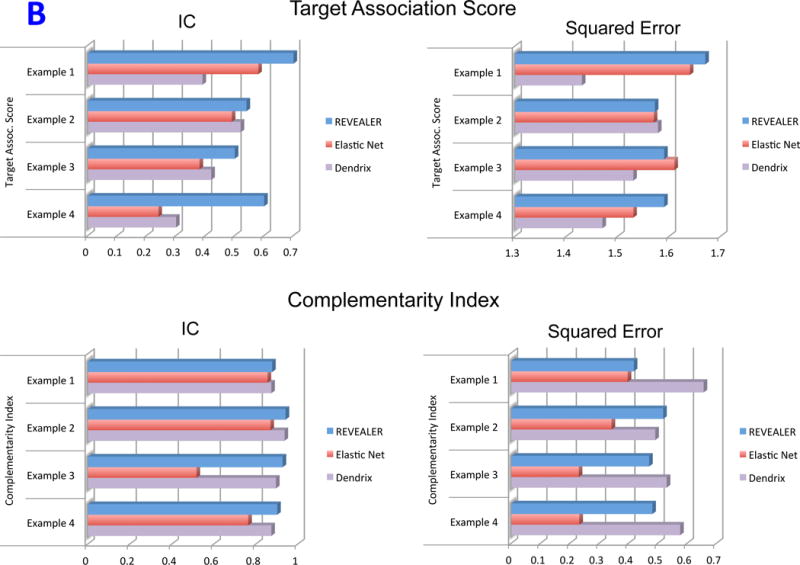
Figure 6.


Simulated data results. A) Summary ROC curves for the simulated data benchmark using the CIC/information-based metric, the PCOR/partial correlation the Elastic Net and mRMR feature selection. B) Bar plot of the across-method comparative analysis of top features shown in Table 1 (IC metric), and the corresponding results using the square error metric instead of the IC.
