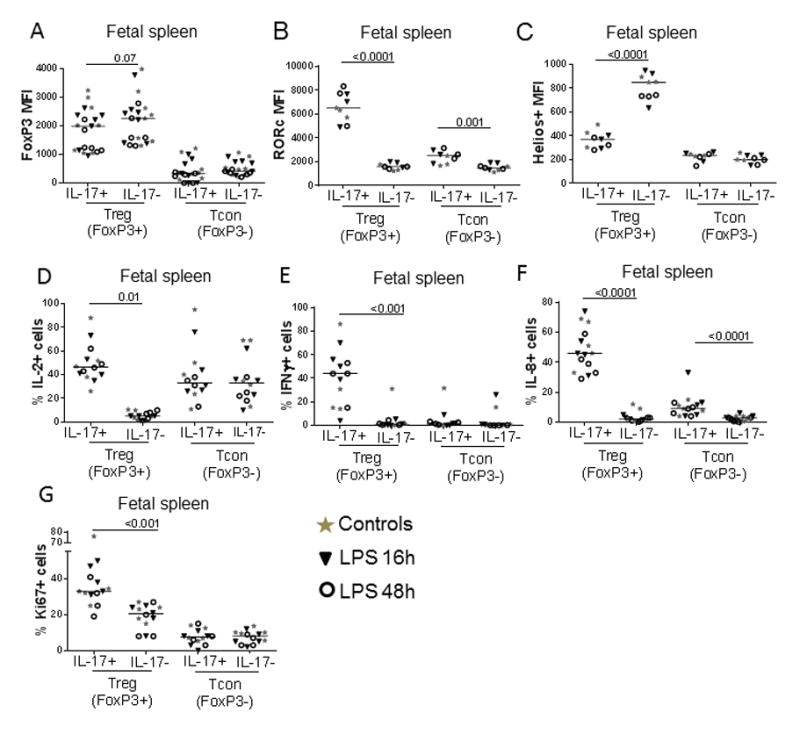
Figure 3. Bifunctional IL17+ Treg exhibited a pro-inflammatory phenotype compared to typical Treg.

Graphs show the phenotype of splenic IL-17+ or IL-17− Treg (defined as CD3+CD4+FoxP3+), as well as that of IL-17+ or IL-17− Tcon counterparts (defined as CD3+CD4+FoxP3−). Panels display A) FoxP3 MFI, B) RORc MFI, C) Helios MFI, D)% of IL-2+, E) % of IFN-γ+, F) % of IL-8+ and G) % of Ki67+ cells in each subset. Each dot represents a single animal, with controls displayed as stars, and LPS-exposed animals displayed as either triangles (16h time point) or circles (48h time point). Bars show the median for each analysis, with all groups combined. P values correspond to Mann-Whitney tests.
