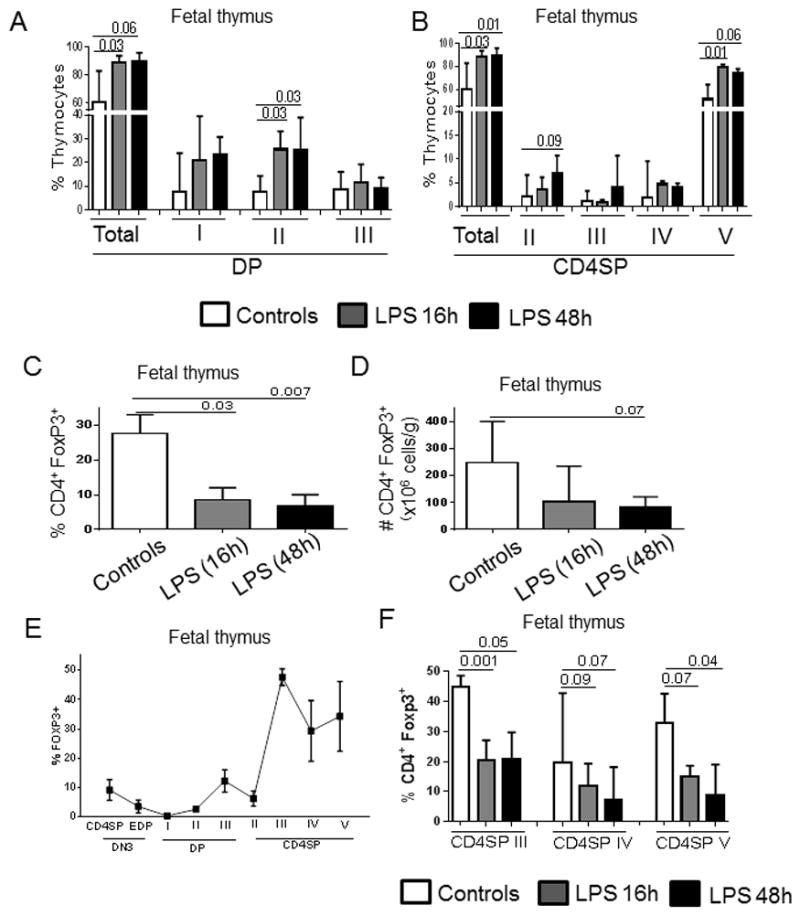
Figure 4. Intra-amniotic LPS alters T-cell development in fetal thymus.

Bars show the median and range: A) the percentage of total double positive (DP) thymocytes and each DP subset (I, II, III); B) the percentage of total CD4 single positive (CD4SP) thymocytes and each CD4SP subset (II, III, IV and V); C) the percentage and D) absolute number of fetal Treg defined as the % of FoxP3+ cells within the total CD4SP thymocytes. E) FoxP3 detection in each stage of thymic development in control fetuses. F) Percentage of fetal Treg defined as the % of FoxP3+ cells within CD4SP III, IV and V stages in control and LPS-exposed fetuses. Control group (n=5) and fetuses exposed to LPS for 16h (n=5) and 48h (n=5) were compared using Mann-Whitney U tests.
