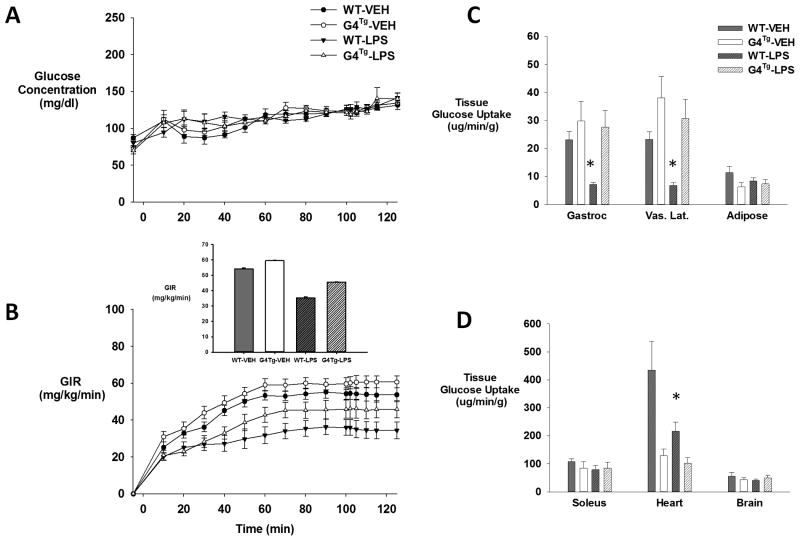
Figure 4.
Arterial blood glucose concentrations (A), Glucose infusion rate (GIR; inset is average GIR during last 40 min of clamp) (B), and tissue (gastrocnemius, superficial vastus lateralis, gonadal adipose tissue, soleus, heart, and brain) glucose uptake (C, D) in GLUT4Tg and their wild-type littermates (WT) that received either vehicle or LPS (10μg/g BW) during a hyperinsulinemic-euglycemic clamp. Data are expressed as mean ±SEM. * (VEH vs. LPS) p<0.05

