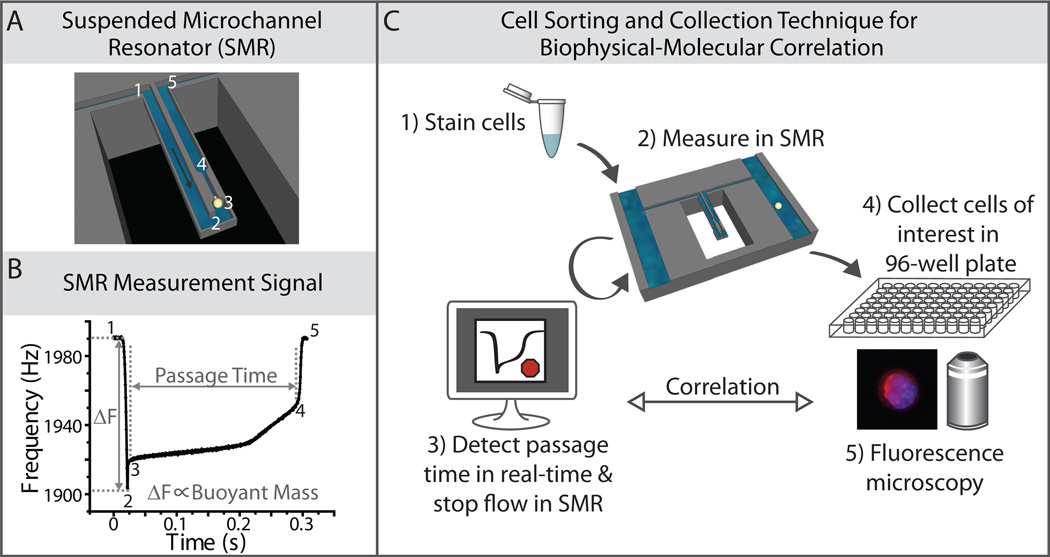
Fig. 1. Cell sorting and collection method for biophysical-molecular correlation.
A) A diagram demonstrating a single cell passing through a suspended microchannel resonator (SMR), squeezing through a constriction. B) An example of the raw resonance frequency signal obtained from a typical cultured tumor cell (an H1650 lung cancer cell in this case) as it transits through the SMR sensor. The height of the frequency shift is proportional to the buoyant mass of the cell, while the width of peak, as it transits from position 3 to position 4, corresponds to the passage time of the cell through the constriction. The numbers in (B) correspond to the position of the cell as labeled in (A). C) A schematic diagram of the cell sorting and collection technique, showing that cells are stained and measured in an SMR. Once the software detects a passage time in the range of interest, it stops the fluid flow in the device, allowing for subsequent collection of the cell off-chip, into a 96-well plate for downstream fluorescence microscopy.

