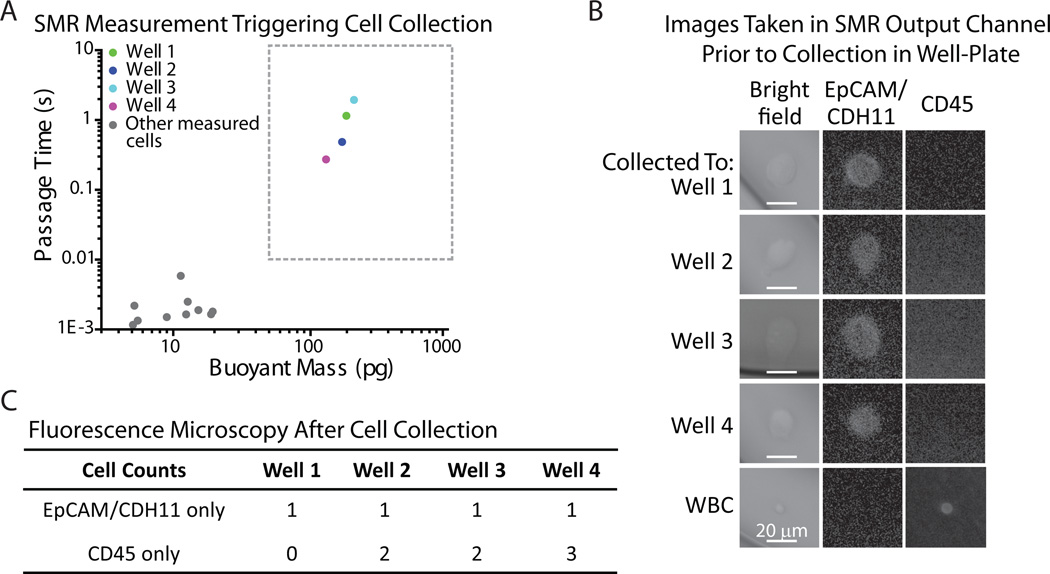
Fig. 3. Validation of single tumor cell detection and collection in 96-well plate.
A) Passage time vs. buoyant mass measurements of H1650 cells spiked into enriched mononuclear blood cells. The cells included in the boxed region (> 50pg buoyant mass & > 0.01 s passage time) were imaged on-chip (B) as well as collected off-chip for additional verification (C). Gray dots outside of the boxed region represent blood cells that were also measured in the SMR during the experiment. B) Images taken on-chip, in the exit channel of the SMR, immediately after custom software detected a long passage time signal. It was confirmed that all detected SMR signals falling into the boxed region of interest (A) corresponded to an H1650 tumor cell by immunofluorescence imaging (EpCAM/CDH11+ and CD45−). C) Each detected H1650 cell was successfully collected off-chip in a 96-well plate. Based on additional immunofluorescence imaging of each well, a tumor cell was identified in each well (EpCAM/CDH11+ and CD45−), along with a few leukocytes (CD45+ and EpCAM/CDH11−).

