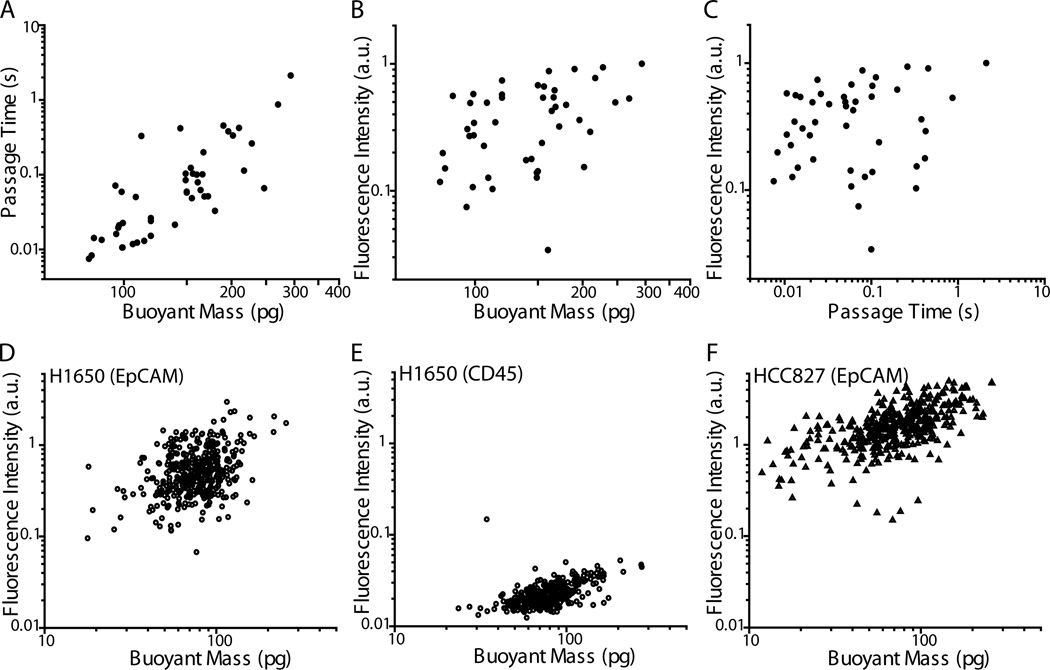
Fig. 5. SMR biophysical measurement correlation with quantified immunofluorescence levels.
A–C) H1650 cells stained for EpCAM were measured by the SMR and individually collected off-chip for assessment by fluorescence microscopy. A) Passage time versus buoyant mass for H1650 cells stained for EpCAM (N = 46 cells, simple linear regression R2 = 0.63). B) From the same data set as in (A) but showing EpCAM fluorescence intensity versus buoyant mass (simple linear regression R2 = 0.14). C) From the same data set as in (A) but showing EpCAM fluorescence intensity versus passage time (simple linear regression R2 = 0.02). D–F) The fluorescence intensities of H1650 and HCC827 cells stained for surface protein expression were assessed on-chip on an SMR via a PMT. D) Fluorescence intensity versus buoyant mass of H1650 cells stained for EpCAM (N = 400, R2 = 0.13). E) Fluorescence intensity versus buoyant mass of H1650 cells stained for CD45, as a control for nonspecific antibody binding (N = 337, R2 = 0.31). Note that cells having fluorescence intensities below the limit of detection were not included. F) Fluorescence intensity versus buoyant mass of HCC827 cells stained for EpCAM (N = 401, R2 = 0.35).

