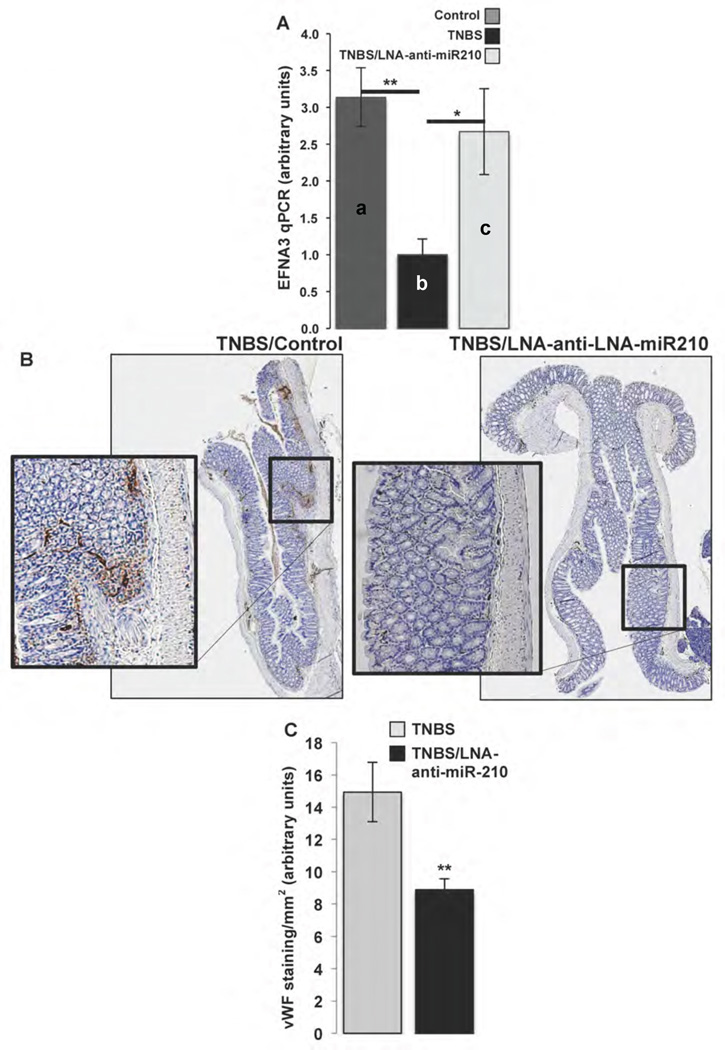
Figure 6.
C57BL6 mice received as indicated intracolonic enema of LNA-anti-miR-210 (10mg/kg), 48 h and 24 h before mice receiving as indicated intracolonic enema of TNBS (250mg/kg). 48 h later mice (n=8) where sacrificed, colon tissues where collected either for RNA isolation and qPCR or were fixed in formalin, embedded in paraffin and endothelial cells where stained with vWF antibody. (A) EFNA3 expression levels were assessed by qPCR. (B) Representative longitudinal section microphotographs (reconstructed from ×5 magnification microphotographs, AxioVission, Carl Zeiss microscopy) of vWF stained colon tissues. (C) Relative colon tissue angiogenesis (vWF positive cells/mm2) quantified by AxioVision (Carl Zeiss microscopy). Statistical analysis was performed using student’s t test. *p<0.05, **p<0.01

