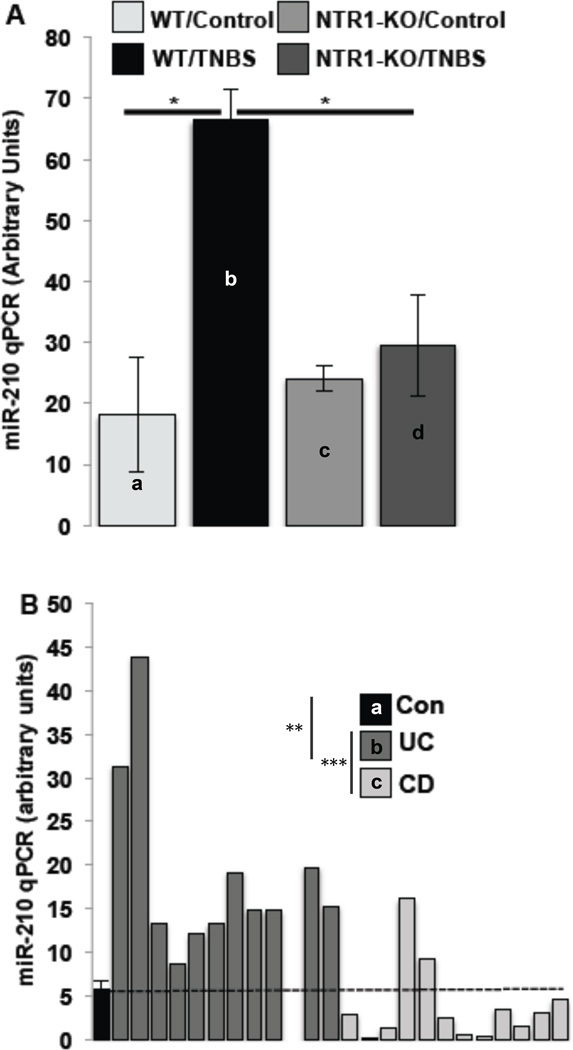
Figure 7.
MiR-210 levels of expression in (A) colon samples from WT or NTR1-KO mice (n=7), treated as indicated with TNBS (48 h) and in (B) human colon samples (n=12 per group) from healthy subjects (shown as mean +/− SEM) and patients with UC or Crohn’s Disease (CD) (shown as individual values), were assessed by qPCR. Statistical analysis was performed using student’s t test. *p<0.05

