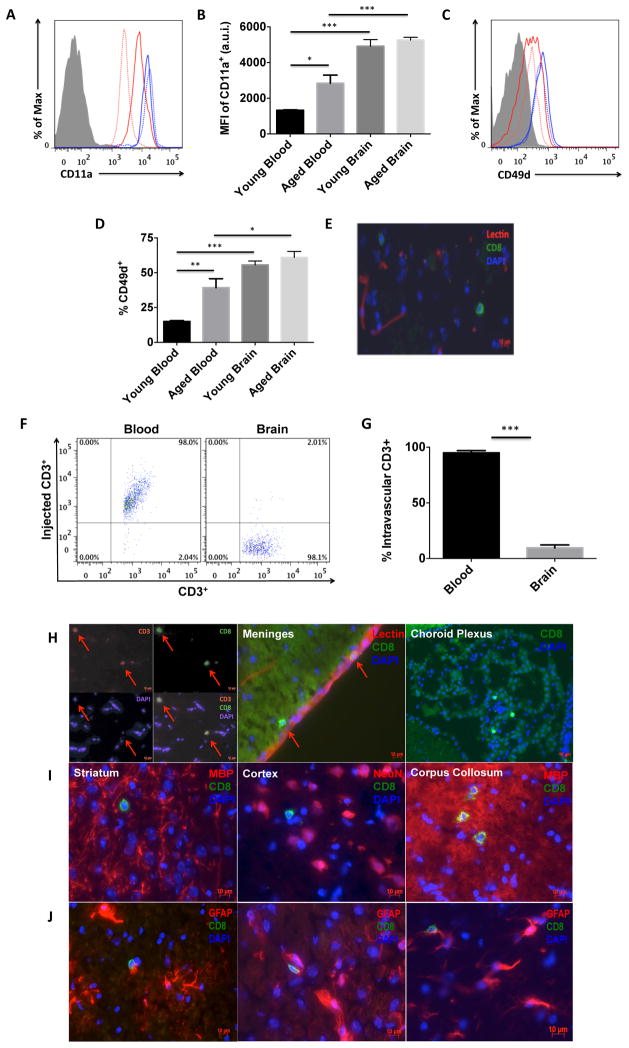
Figure 3. Extravasation of CD8 T cells is higher into the aged brain.
Representative histograms depict the relative expression of the adhesion molecules CD11a (A) and CD49d (C) on CD8 T cells from the blood (red) and brain (blue) of young (dotted) and aged (solid) mice. Quantification of the mean fluorescence intensity of CD11a+ (B; N=5–6/group) and percentage of CD49d+ (D; N=9–10/group) CD8 T cells is shown. Immunohistochemistry shows the presence of CD8-positive cells (green) outside of lectin-positive (red) blood vessels (E). A representative dot plot from the Intravascular labeling experiment shows the absence of injected-CD3+ antibody on CD8 T cells in the aged brain (F; N= 8/group). The percentage of intravascular-labeled CD3+ CD8 T cells was quantified (G) in the aged brain and blood (for positive control). Representative 10um-thick brain tissue sections illustrating the presence of CD3+CD8+ T cells in the aged brain, meninges, and choroid plexus (H; scale bar = 10μm). CD8+ T cells were found throughout the anterior-posterior axis of the brain, including the striatum, cortex, and corpus collosum (I) and in association with activated astrocytes (J). Cell-specific FMO controls were used to determine positive gating (shaded gray). Error bars show mean SEM. Abbreviation: SEM standard error of mean, DAPI 4′,6-diamidino-2-phenylindole, MBP myelin basic protein, NeuN neuronal nuclei, GFAP glial fibrillary acidic protein. *p<0.05; **p<0.01; ***p<0.001

