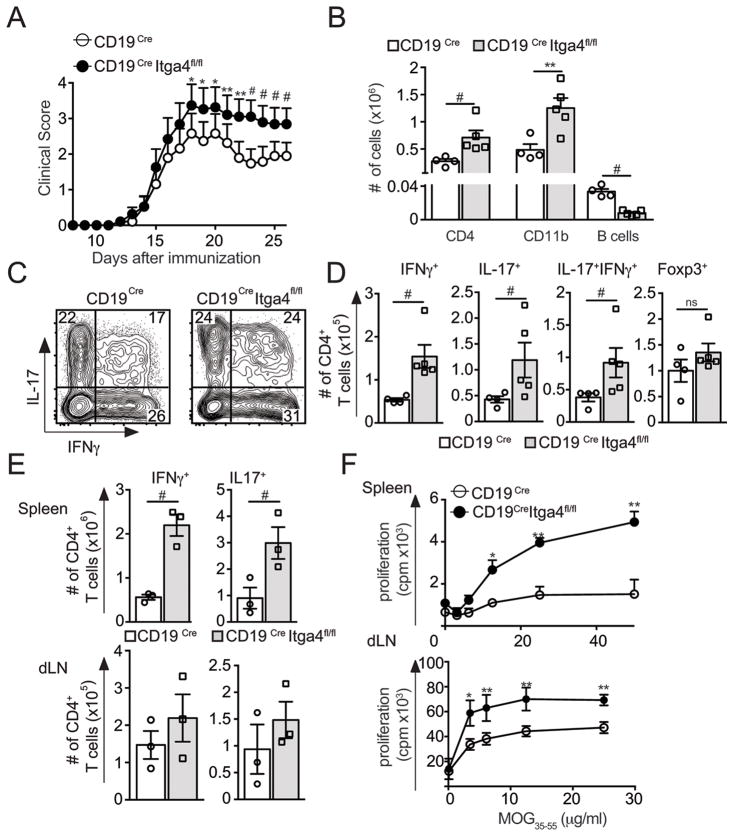
Figure 1. Deletion of Itga4 in B cells leads to EAE exacerbation.
(A–D) EAE was induced in CD19Cre Itga4fl/fl mice and CD19Cre mice. The mean clinical score is shown for each group over time (± SEM). (B) At the peak of the disease, CNS cells were collected. Surface and intracellular cytokine staining of CNS-infiltrating CD4+ T cells were performed and absolute numbers of CNS-infiltrating CD4+ T cells, CD11b+ cells and CD19+ B cells were determined. (C) The plots show the percentages of IL17+, IFNγ+ cells gated on CD4+ T cells. (D) Absolute numbers of Th1 (IFNγ+IL17−), Th17 (IFNγ−IL17+), Th1-17 (IFNγ+IL17+) and Tregs (CD4+ Foxp3+) in the CNS of CD19Cre Itga4fl/fl mice (grey) and CD19Cre mice (white) were determined from 2 independent experiments with 5 mice per group. (E–F) Spleen and draining lymph node (dLN) cells were collected from MOG35-55-immunized mice 8 days after immunization and an intracellular cytokine staining on CD4+ T cells was performed. (E) Mean absolute numbers of IL17+and IFNγ+ producing CD4+ T cells in the spleen (top) and dLN (bottom) for both groups. (F) Proliferative response after MOG restimulation of splenic and dLN cells isolated from MOG35-55-immunized CD19Cre Itga4fl/fl mice and CD19Cre mice was measured by [3H] thymidine incorporation. Results are representative of 2 independent experiments. Statistical significance was designated as follows: * p<0.05 **; p<0.01 and # p<0.005.

