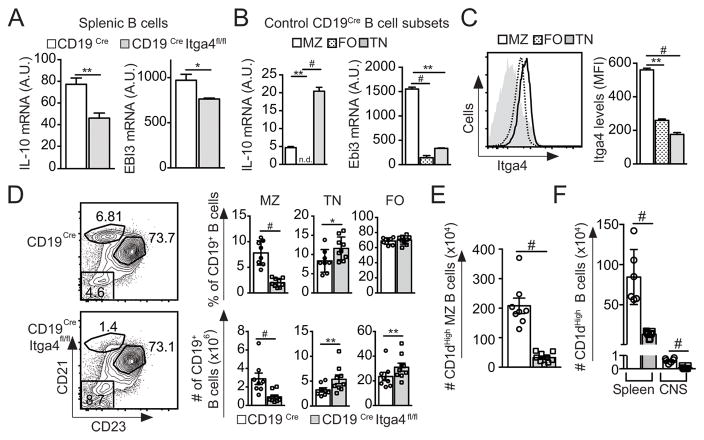
Figure 2. Itga4 expression by B cells is crucial for the presence of regulatory B cell in the spleen.
Splenocytes were collected from naïve CD19Cre Itga4fl/fl mice and CD19Cre mice. (A) B cells were isolated and IL-10 and Ebi3 mRNA relative expression were determined by quantitative PCR. (*p<0.05; **p<0.01 and #p<0.005). (B) IL-10 and Ebi3 mRNA relative expression on sorted marginal zone (MZ: B220+CD21HighCD23Low), follicular (FO: B220+CD21+CD23+) and transitional (TN: B220+CD21−CD23−) B cells from CD19Cre mice. (C) Expression of Itga4 expression on MZ (black line), FO (dotted line) and TN B cells (grey histogram) from CD19Cre mice as identified in B. (D) Representative CD21 and CD23 expression gated on CD19+ B cells from CD19Cre Itga4fl/fl mice (bottom) and CD19Cre mice (top) to define three B cell subsets: MZ (CD21HighCD23−), TN (CD21negCD23+) and FO (CD21+CD23+). Mean frequency (top) and absolute numbers (bottom) of each B cell subsets from CD19Cre Itga4fl/fl mice (grey) and CD19Cre mice (white) determined from 3 independent experiments with 7–10 mice per group. (E) Absolute numbers of CD1d+ MZ B cells from naive CD19Cre Itga4fl/fl mice and CD19Cre mice. (F) Absolute numbers of CD1d+ among B cells in the spleen and CNS of CD19Cre Itga4fl/fl mice and CD19Cre mice at the peak of EAE. Statistical significance was designated as follows: * p<0.05 **; p<0.01 and # p<0.005.

