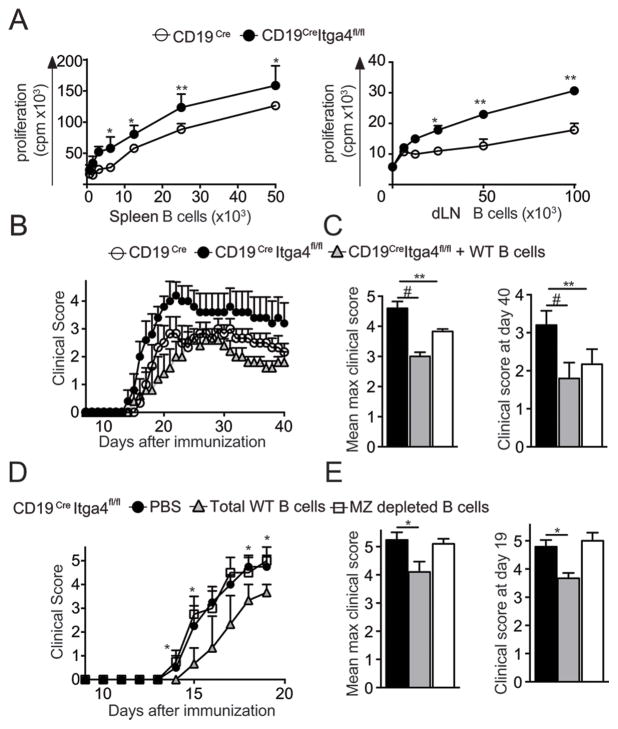
Figure 3. Itga4 sufficient B cells can control EAE severity in CD19Cre Itga4fl/fl mice.
(A) Proliferative response of 2D2 Tg CD4+ T cells (MOG35-55 TCR Tg mice) stimulated with MOG35-55 and increasing numbers of B cells isolated from spleen (left) or dLN (right) of MOG35-55-immunized CD19Cre Itga4fl/fl mice (filled circles) and CD19Cre mice (open circles) was measured by [3H] thymidine incorporation. Results are representative of 2 independent experiments with 4 mice. (B) One group of CD19Cre Itga4fl/fl mice was injected intravenously one day prior to immunization with 10×106 untouched B cells isolated from spleen of WT mice (grey triangles). Another group of CD19Cre Itga4fl/fl mice (closed circles) and a group of CD19Cre mice (open circles) received PBS. The next day, all mice were immunized for the development of EAE. The mean clinical score is shown for each group over time (± SEM). (C) Mean maximum clinical score and mean clinical score at the end of the experiment (day 40) were calculated for each group (n= 7 mice per group). (D) CD19Cre Itga4fl/fl mice received PBS (black circle) or 10×106 total WT B cells (grey triangles), or MZ depleted B cells (clear rectangle) as described in (B) and were immunized for EAE development. The mean clinical score is shown for each group over time (± SEM). (E) Mean maximum clinical score and mean clinical score at the day 19 were calculated for each group. Statistical significance was designated as follows: * p<0.05 **; p<0.01 and # p<0.005.

