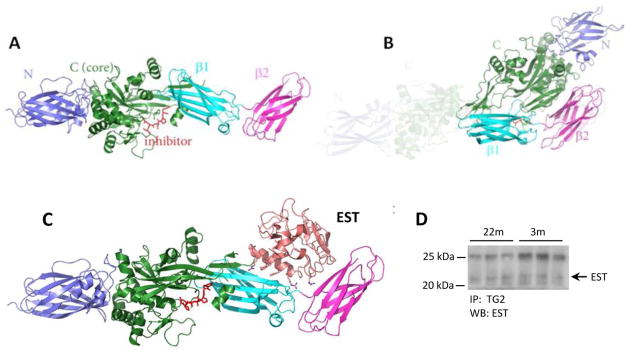
Fig 9. The ribbon model of TG2 and EST binding and Co-Immunoprecipitation of TG2 and EST.
(A) Open (active) conformation of TG2. The position of “inhibitor” highlights the active site of the enzyme. (B) Closed (inactive) conformation of TG2. The shaded area represents the former “open” conformation. (C) Model of EST binding to TG2 that leads to “freezing” TG2 in the open conformation. The position of EST denotes the mechanics of a forcible open conformation of TG2. It can also be postulated that the form of the enzyme lacking α- and β-barrels (the 53kDa fragment) should exhibit constitutively active catalytic site. (D) Kidney lysates (500 μg proteins) were immunoprecipitated with anti-TG2 antibodies followed by immunoblotting with anti-EST antibodies. The predicted EST band is indicated by an arrow on the right. The upper band at position around 25 kDa is the IgG light chain.

