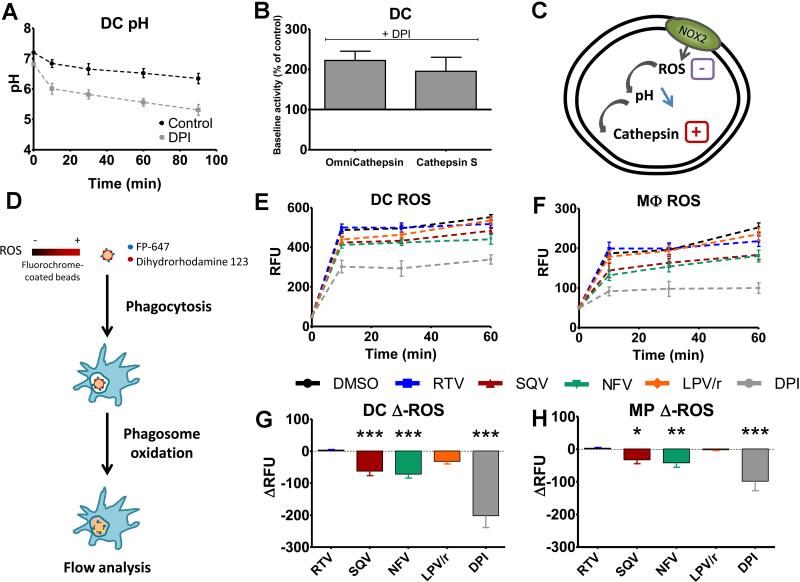
FIGURE 3. HIV PIs alter ROS production in DC phagosomes.
(A) DC phagosome pH measurement over time after 30min treatment with DMSO (black) or 10 μM DPI (gray). Average +/− SD of 3 independent experiments. (B) Omnicathepsin and cathepsin S activities in DCs after 30min treatment with 10μM DPI. 100% represents the maximum slope of DMSO-treated DCs. Average +/− SD of 3 independent experiments. (C) Representation of the hypothesis: PIs inhibit ROS production, leading to phagosome acidification and cathepsin activation. (D) Representation of the method to used measure phagosomal ROS. ROS measurement in DCs (E) and macrophages (F) after a 30min pretreatment with 5μM PI or 10μM DPI. Differences in ROS production in phagosomes of DCs (G) and macrophages (H) after treatment with different PIs or DPI compared to DMSO 60min after phagocytosis. Data represent average of cells from 5 healthy donors. *p< 0.05, **p <0.01, ***p <0.001.

